


公式サプライヤー
公式および認定ディストリビューターとして200社以上の開発元から正規ライセンスを直接ご提供いたします。
当社のすべてのブランドをご覧ください。
DevExtreme Complete is a robust suite of tools by DevExpress designed to streamline the development of high-performance web applications. It includes a wide range of UI components for modern frameworks such as Angular, React, Vue, and jQuery, making it ideal for developers aiming to create responsive, cross-platform applications with ease. With features like rich data visualization, interactive grids, form controls, and adaptive layouts, it empowers developers to deliver polished and user-friendly interfaces. Whether you're building enterprise dashboards or consumer-facing apps, DevExtreme Complete provides the flexibility and power to meet complex requirements while maintaining performance and usability.
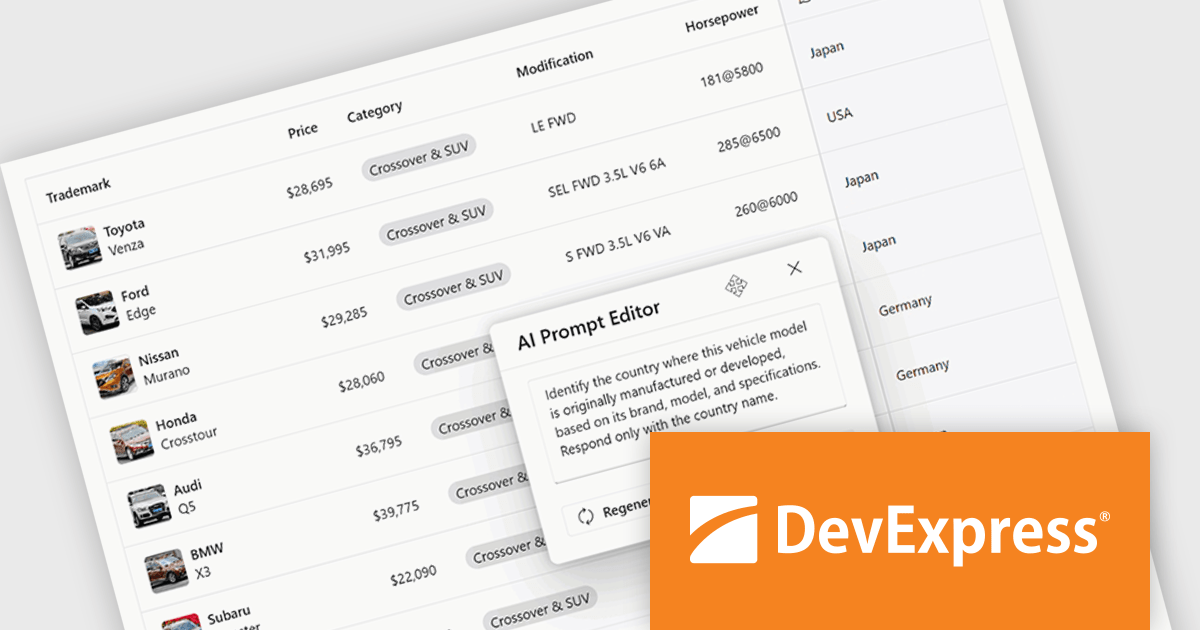
The DevExtreme Complete 25.2 release brings AI Columns to its DataGrid and TreeList components, allowing developers to infuse artificial intelligence directly into their data presentation layers. AI Columns use component data and custom prompts to generate contextually relevant values - automating tasks like categorization, summarization, translation, and recommendation. Whether grouping records by priority, detecting sentiment, or transforming addresses, this feature opens up new ways to interact with and analyze structured data, making these components powerful tools for AI-assisted data exploration.
To see a full list of what's new in version 25.2, see our release notes.
DevExtreme Complete is licensed per developer and is available as a Perpetual License with a 12 month support and maintenance subscription. See our DevExtreme Complete licensing page for full details.
DevExtreme Complete is available to buy individually or as part of the following products:
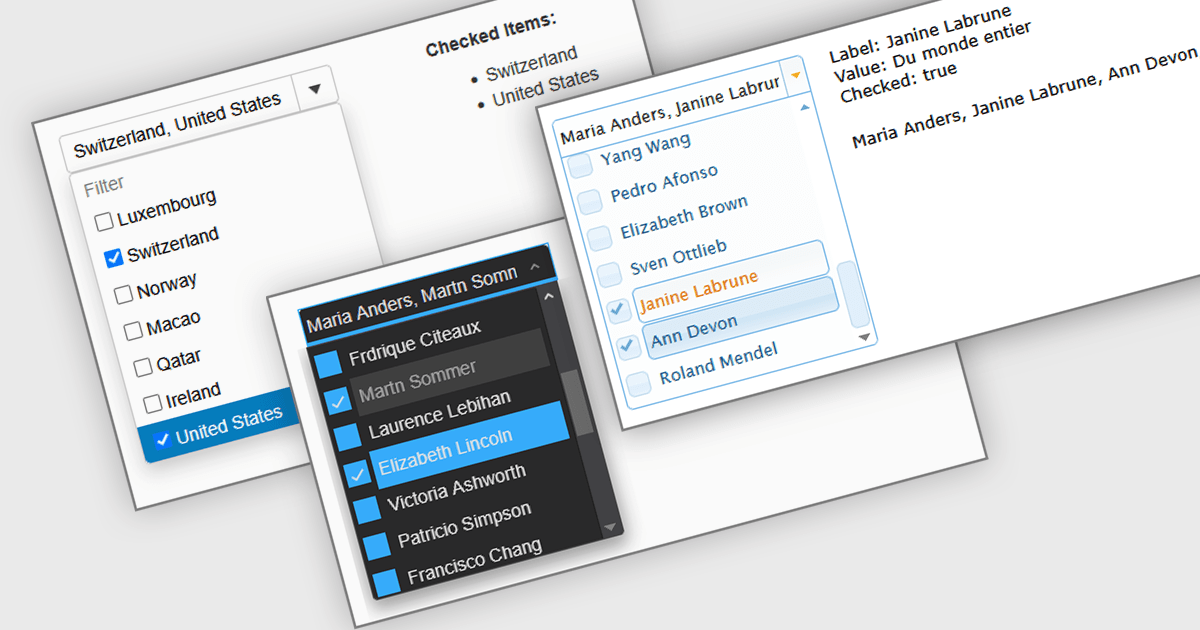
A Checked Combobox in a JavaScript Data Editor is a user interface component that allows users to select multiple options from a dropdown list using checkboxes. It combines the compact form of a combobox with the functionality of a multi-select control, helping to conserve screen space while enabling clear, granular input. This component simplifies data entry and editing workflows, particularly when working with datasets that require multiple discrete values to be associated with a single field. For developers, it offers a way to manage complex form inputs more efficiently, improving both usability and data integrity in cross-platform data management applications.
Several JavaScript data editors offer checked combobox functionality including:
For an in-depth analysis of features and price, visit our comparison of JavaScript data editors.

Calendar controls are a fundamental component in modern UI suites, providing users with an intuitive way to view, select, and manage dates within applications. They are commonly used in scenarios such as scheduling, booking, reporting, and data filtering, offering consistent date interaction patterns, localization support, and easy integration with other input and data-driven components.
Several Angular UI suites offer calendar components including:
For an in-depth analysis of features and price, visit our Angular UI suites comparison.

インフラジスティックス・ジャパン株式会社は、Web アプリケーション向け有償 UI ライブラリ「Ignite UI」の一部をオープンソース版として無償提供開始しました。これにより、Grid Lite、Button、Calendar、Stepper など 50 種類以上の UI コンポーネントが商用・非商用問わず利用可能になります。Angular、Blazor、React、Web Components といった主要フレームワークに対応し、UI 部品を一から自作せずに高品質な UI を素早く構築できる環境が整いました。無償版は OSS コミュニティベースのサポートで、日本語テクニカルサポートは付帯しませんが、Discord や GitHub での協力が可能です。一方、より高度なグリッド機能やエンタープライズ向けコンポーネントは引き続き有償のプレミアム版で提供されます。小規模開発やプロトタイプにも適したこのオープンソース化は、Web 開発現場の負担軽減に寄与する重要な一歩です
一方、有料版では、大規模データ対応の高機能グリッド、豊富なチャート、高度なフィルタリングやエクスポート機能など、エンタープライズ開発に不可欠な機能が利用可能です。さらに、公式の技術サポート、定期的なアップデート、長期的な製品保守により、業務システムでも安心して導入できます。なお、OSSと有料版を使い分けることで、開発規模に応じた最適なUI戦略が可能になります。
Ignite UI有料版の製品情報及び購入情報は以下のリンクをご参考ください。

SpreadJS is a JavaScript spreadsheet and data visualization component built to deliver Excel-compatible functionality within web applications. It provides a flexible, high-performance interface for displaying and manipulating tabular data, supporting advanced features such as formulas, pivot tables, charts, conditional formatting, and data binding. SpreadJS integrates smoothly with popular frameworks like React, Angular, and Vue, and includes robust import and export capabilities for Microsoft Excel files. It is commonly used in enterprise applications where users need a responsive, interactive spreadsheet experience directly in the browser.
The SpreadJS 19.0.0 update introduces a new Collaboration Server Add‑on that enables real‑time, multi‑user editing of the same spreadsheet within web applications by integrating the collaboration framework and server infrastructure directly into SpreadJS. This add‑on lets developers build functionality where multiple clients see and apply changes instantly to workbook data with consistent state across users, supports conflict‑free concurrent edits using Operational Transformation logic, and includes features such as live user presence and permission controls.
To see a full list of what's new in 19.0.0, see our release notes.
SpreadJS is licensed per developer and includes 1 Year Maintenance (major and minor version releases and unlimited support phone calls). SpreadJS requires an Annual or Perpetual Deployment License. The optional Add-ons are available at an additional cost, and require a SpreadJS license. See our SpreadJS licensing page for full details.
For more information, visit our SpreadJS product page.
電話: (888) 850 9911
Fax: +1 770 250 6199


