













公式サプライヤー
公式および認定ディストリビューターとして200社以上の開発元から正規ライセンスを直接ご提供いたします。
当社のすべてのブランドをご覧ください。
DevExtreme Complete is a comprehensive JavaScript UI component suite developed by DevExpress. It provides a wide range of features and tools to help developers build high-performance and responsive web applications for various platforms, including traditional web, mobile, and next-generation web technologies.
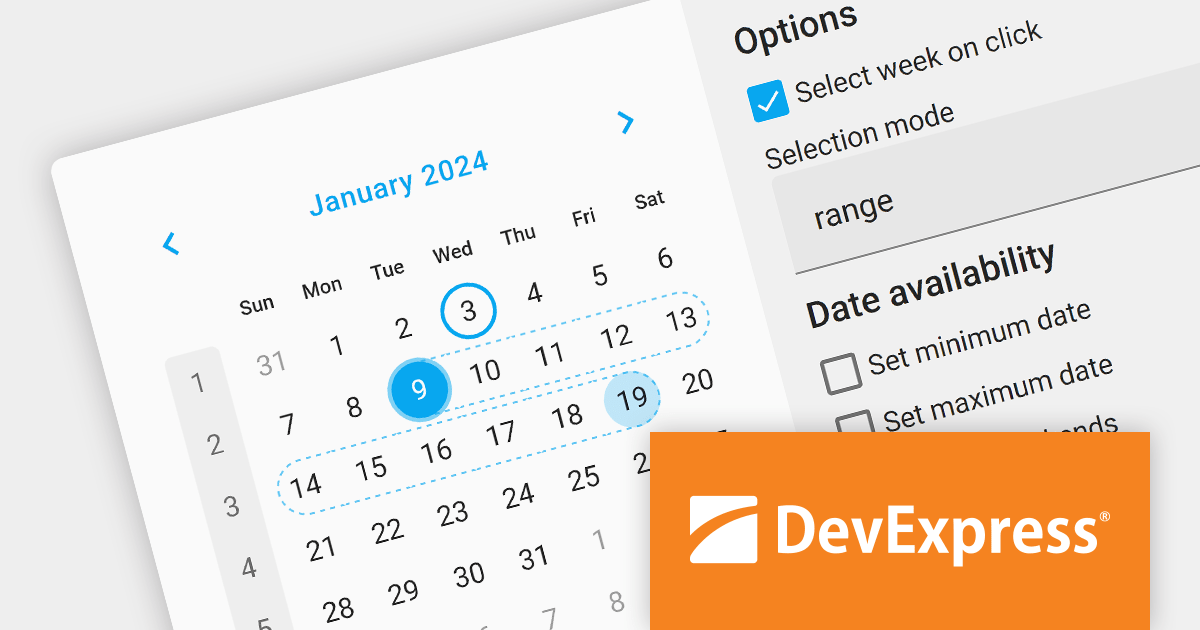
The DevExtreme Complete 23.2 update brings powerful date selection options to the Calendar. You can now select single dates, multiple, or choose a date range with ease. The initial view can be set as a single date or an array, and entire weeks can be selected by clicking on the week number. These powerful new selection enhancements make date selection easier for novices and advanced users alike.
To see a full list of what's new in version 23.2, see our release notes.
DevExtreme Complete is licensed per developer and is available as a Perpetual License with a 12 month support and maintenance subscription. We can supply any DevExtreme Complete license including new subscriptions, subscription renewals, expired subscription renewals, and additional licenses. See our DevExtreme Complete licensing page for full details.
DevExtreme Complete is available to buy in the following products:

Financial apps can be significantly enriched by integrating open-high-low-close charts. These versatile visualizations condense price movement data into clear, concise bars, empowering users to rapidly grasp market trends and identify potential trading opportunities. With a quick glance, users can assess open, high, low, and closing prices within a chosen timeframe, gaining valuable insights into market sentiment and volatility. This immediate understanding fosters informed decision-making, transforming your Vue.js app into a dynamic platform for financial analysis and informed action.
Several Vue.js chart controls offer OHLC charts including:
For an in-depth analysis of features and price, visit our Vue.js chart controls comparison.
SpreadJS by MESCIUS is a powerful JavaScript library that lets you build Excel-like spreadsheets within your web applications. It offers tables, charts, formulas, pivot tables, and more, all running within the browser. It works with major frameworks like Angular, React, and Vue, and offers Excel file import and export. SpreadJS empowers developers to create interactive dashboards, analyze data, and streamline workflows, all within the familiar spreadsheet interface.
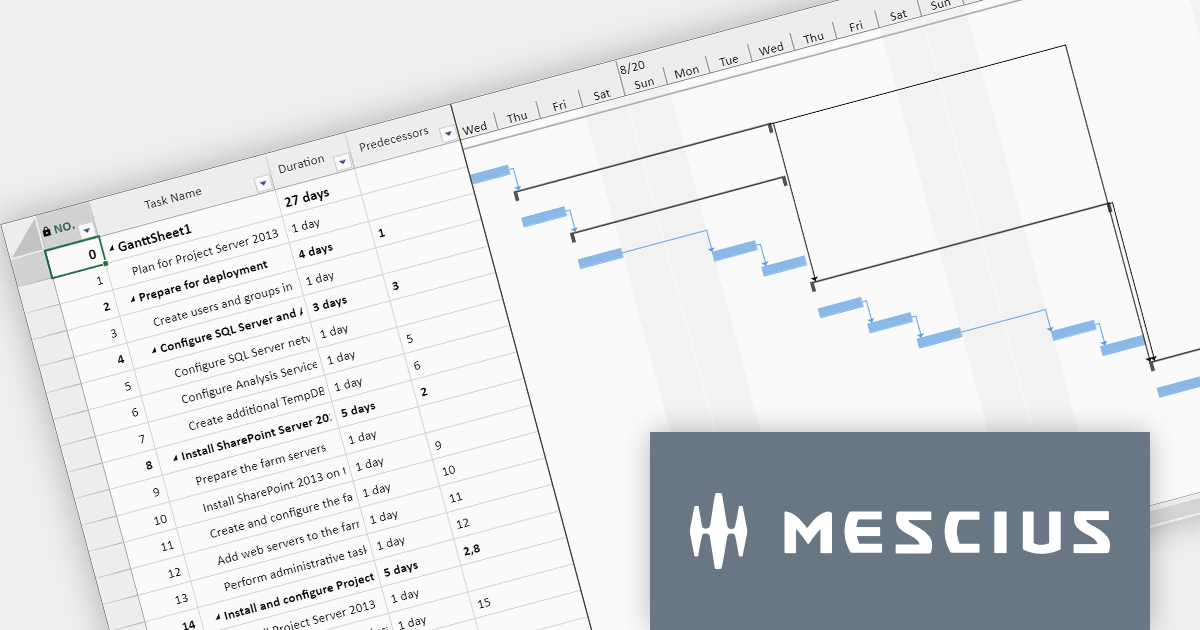
The SpreadJS 17 release introduces the optional GanttSheet Add-On, a full Gantt implementation that works inside of SpreadJS. It seamlessly integrates with your existing spreadsheets, transforming them into clear and concise Gantt charts. This allows you to visualize tasks, dependencies, and progress at a glance, identifying potential bottlenecks and adjust schedules proactively. GanttSheet offers a flexible and intuitive may to manage tasks, sort data, customize calendar settings, and even import/export plans for smooth collaboration.
To see a full list of what's new in version 17, see our release notes.
SpreadJS is licensed per developer and includes 1 Year Maintenance (major and minor version releases and unlimited support phone calls). SpreadJS requires an Annual or Perpetual Deployment License. The GanttSheet Add-On is available at an additional cost, and requires a SpreadJS license. See our SpreadJS licensing page for full details.
For more information, visit our SpreadJS product page.

IronPDF for Node.js lets you generate, edit, and extract PDF content in Node.js projects. It is designed for Node.js 12+ and is compatible with various operating systems including Windows, macOS and Linux, and IDEs such as JetBrains WebStorm and Microsoft Visual Studio Code. Its key features include generating PDFs programmatically using Node.js, creating PDFs from HTML, CSS, and JavaScript, adding headers/footers, watermarks or attachments to PDF documents, and securing PDFs using passwords, metadata and digital signatures.
IronPDF for Node.js is licensed per developer and is available as a perpetual license with 1 year of product updates and support services. Lite, Plus and Professional Licenses are available for different development and distribution requirements. See our IronPDF for Node.js licensing page for full details.
IronPDF for Node.js is available to buy in the following products:
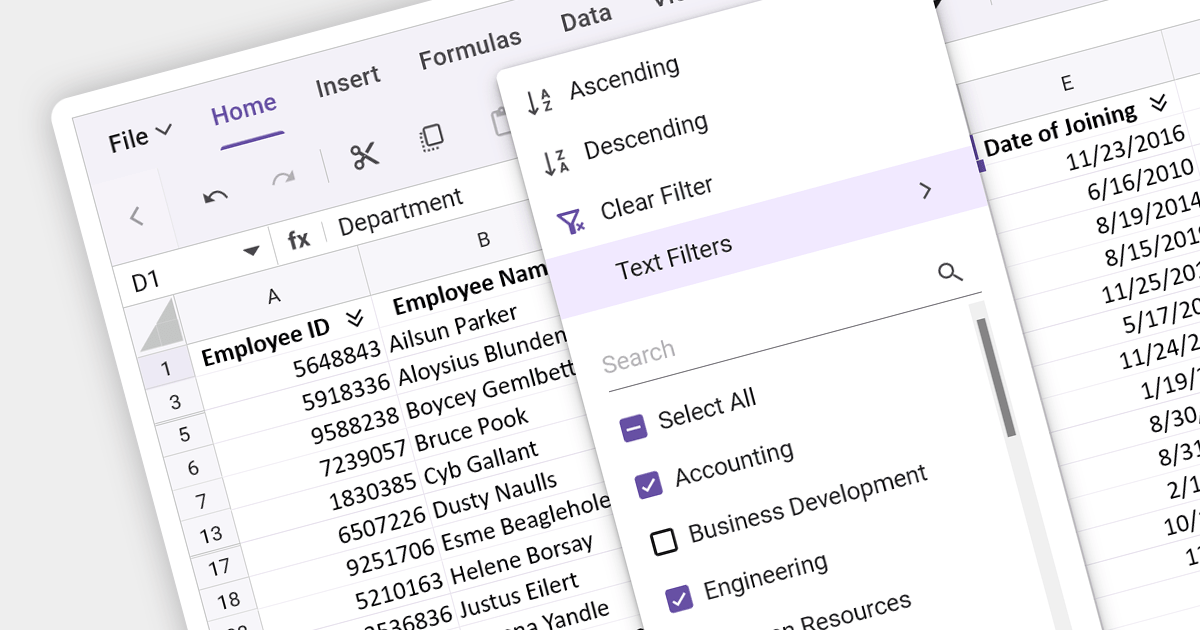
Data filtering and grouping are key spreadsheet features that allow users to manage and analyze large datasets efficiently. Filtering enables users to hide data that does not meet certain criteria, making it easier to focus on relevant information. Grouping clusters related data together, which can then be summarized with functions such as sum, average, and count. These features are vital for working with extensive spreadsheets, enabling users to simplify their view, and gain insights from specific subsets of data.
Several Angular Spreadsheet components provide data filtering and grouping support including:
For an in-depth analysis of features and price, visit our Angular Spreadsheet Component comparison.
電話: (888) 850 9911
Fax: +1 770 250 6199


