


公式サプライヤー
公式および認定ディストリビューターとして200社以上の開発元から正規ライセンスを直接ご提供いたします。
当社のすべてのブランドをご覧ください。
ComponentSource, a leading global provider of software components and development tools, has announced a new partnership with MDBootstrap, a software development company that specializes in Material Design based UI components and templates for responsive JavaScript web apps. This collaboration aims to offer customers a seamless experience by combining ComponentSource's extensive library of software components and developer tools with MDBootstrap's expertise in developing high-quality UI solutions.
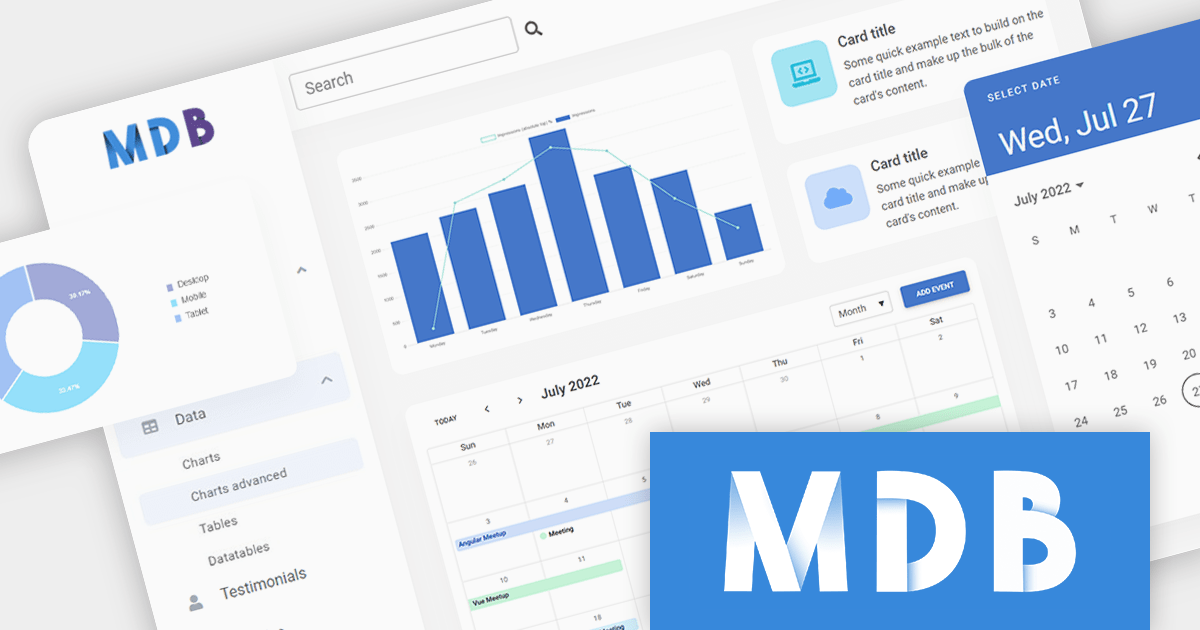
MDBootstrap (also known as MDB), is a front-end development framework that combines the features of Bootstrap with Material Design. Available for JavaScript, Bootstrap, Angular, React, and Vue, it provides a comprehensive set of UI components, design blocks, and templates to help developers quickly and easily create modern and responsive web applications. MDBootstrap controls are used by over 3,000,000 developers and designers, including global brands such as Amazon, Samsung, Nike and IKEA.
Through this strategic partnership, ComponentSource enhances its extensive offering of premium software components, further cementing its position as a trusted provider of reliable and efficient solutions for developers, backed by guaranteed support.
For more information, explore the MDBootstrap product range.
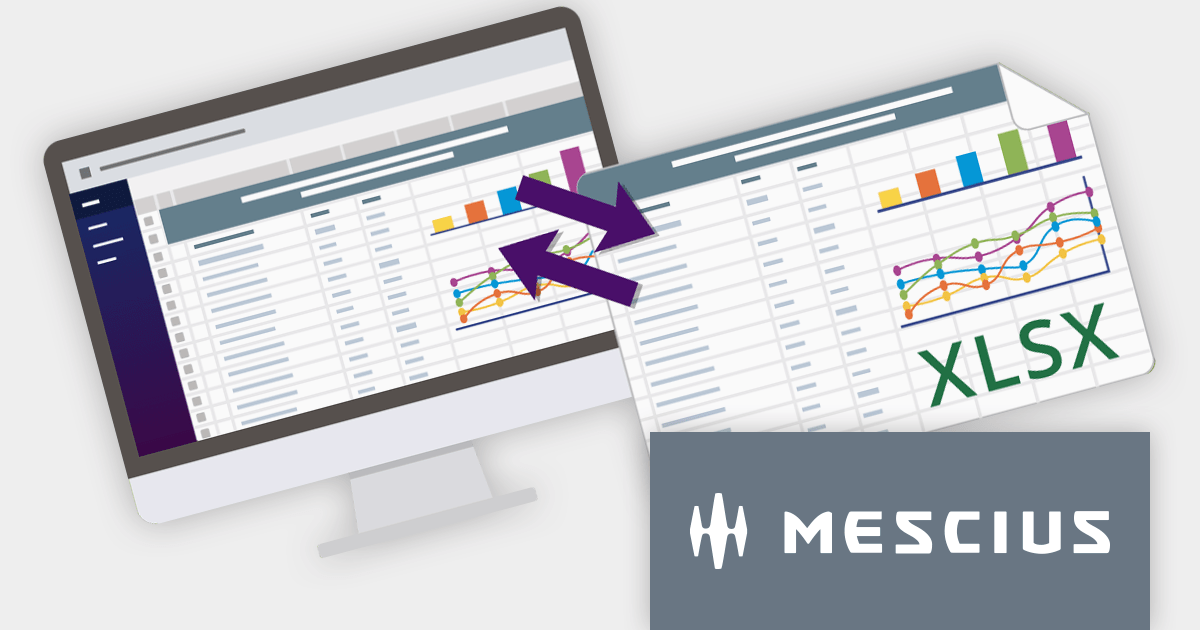
SpreadJS is a complete enterprise JavaScript spreadsheet solution used to create financial reports and dashboards, budgeting and forecasting models, scientific, engineering, healthcare, education, science lab notebooks, and other similar JavaScript business applications. Spreadsheets are a primary medium for displaying and sharing vital company data and it is crucial that this data can be easily viewed and updated in your JavaScript applications.
In this blog post, MESCIUS Product Manager Kevin Ashley shows you how to leverage the power of SpreadJS to import and export Excel spreadsheets into your enterprise web applications. Steps include:
View the complete blog and start working directly with Excel files in your JavaScript applications.
For more information visit our SpreadJS product page.
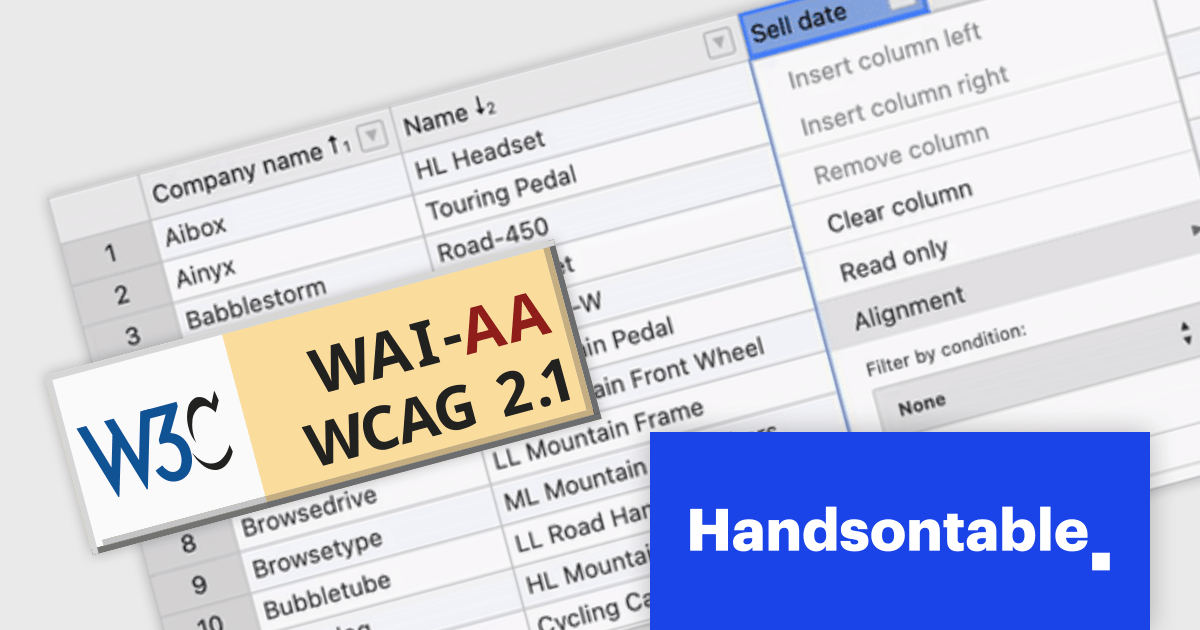
Handsontable is a JavaScript data grid component that provides a spreadsheet-like user experience for web applications. It allows developers to easily integrate data tables into their web pages, enabling users to manipulate data in a familiar and intuitive way.
Handsontable V14 now meets Web Content Accessibility Guidelines (WCAG) 2.1 AA standards, making it easier for people with disabilities to use the grid. This release also enhances screen reader compatibility by incorporating ARIA attributes into the HTML markup, ensuring seamless navigation for users of NVDA and JAWS on Windows, and VoiceOver on macOS.
To see a full list of what's new in version 14.0.0, see our release notes.
For more information, visit our Handsontable product page.
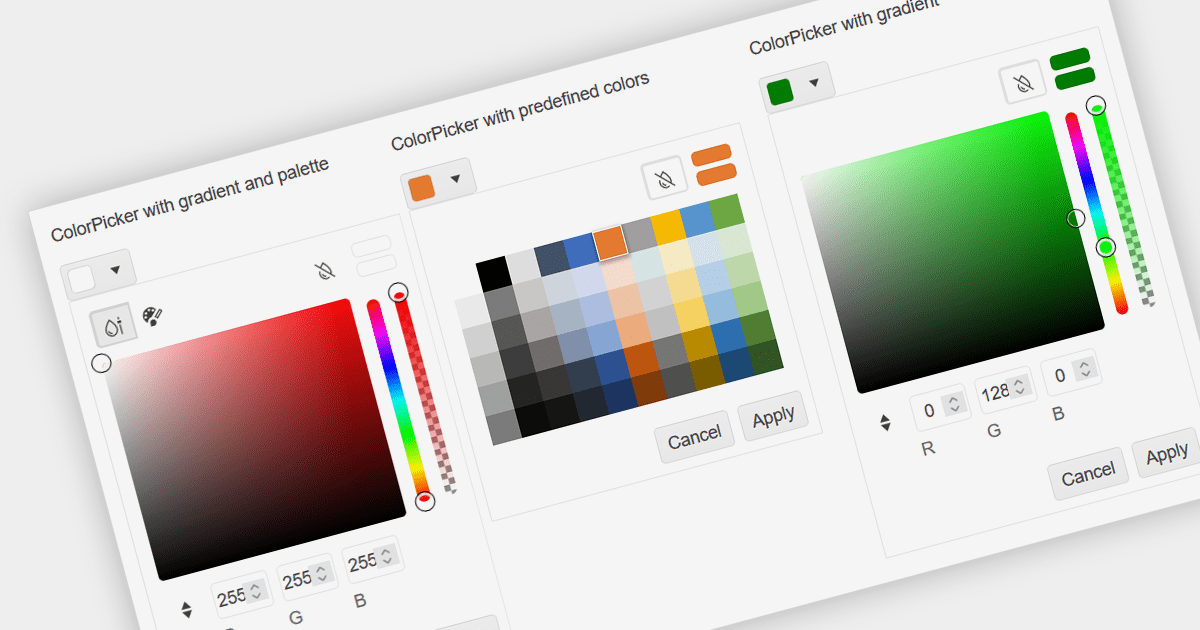
A color picker is a graphical tool that allows users to select colors from a palette or by adjusting different color parameters. Color pickers are commonly found in graphics software, web development tools, and design applications. They are used to ensure accurate and visually appealing color choices in various creative and technical projects. Color pickers provide an intuitive way to select precise colors, commonly by using sliders for RGB values or hex codes.
Several Vue.js data editor collections provide color pickers including:
For an in-depth analysis of features and price, visit our Vue Data Editors comparison.
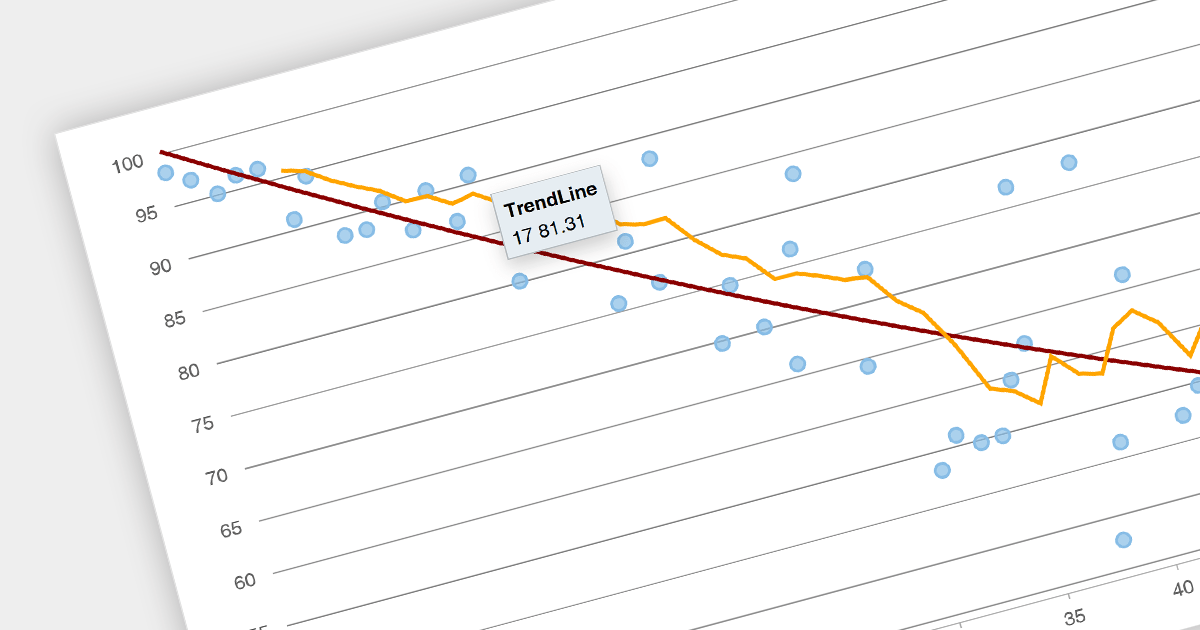
Trend lines are a chart feature used to indicate patterns or trends in data over time. Common examples include linear, exponential, polynomial, logarithmic, and moving average. Trend lines are crucial for making predictions or understanding the direction of data points in scatter plots and line charts, helping make data-driven decisions.
Several Angular chart components provide trend line support including:
For an in-depth analysis of features and price, visit our Angular Chart Component comparison.
電話: (888) 850 9911
Fax: +1 770 250 6199


