


公式サプライヤー
公式および認定ディストリビューターとして200社以上の開発元から正規ライセンスを直接ご提供いたします。
当社のすべてのブランドをご覧ください。

ONLYOFFICE Docs Enterprise Edition with Drupal Connector lets teams edit and collaborate on office files directly within Drupal’s Media module, streamlining content creation and management. It integrates the full ONLYOFFICE Docs suite for text documents, spreadsheets, and presentations, supporting formats like DOCX, XLSX, PPTX, ODT, ODS, ODP, PDF, TXT, RTF, HTML, EPUB, and CSV with full OOXML compatibility. Users can create documents, build spreadsheets, and design presentations collaboratively in real time, all in their browser. With options for customization and rebranding, it enhances productivity and delivers a seamless, integrated digital experience.
The ONLYOFFICE Docs Enterprise Edition with Drupal Connector v9.0.4 update introduces the ability to edit PDF forms directly within Drupal, allowing developers and administrators to modify fields, adjust layouts, and update existing forms without re-uploading files. This enhancement improves form management by keeping all edits within the Drupal environment and saving changes back to the original templates, reducing versioning issues and eliminating the need for external tools. It simplifies maintenance, accelerates updates, and ensures that form templates remain consistent and accessible throughout the development lifecycle.
To see a full list of what's new in v9.0.4 (2.0.0), see our release notes.
ONLYOFFICE Docs is licensed by the number of simultaneous document connections and is available as an annual license with 1 year support and upgrades. See our ONLYOFFICE Docs licensing page for full details.
For more information, see our ONLYOFFICE Docs Enterprise Edition with Drupal Connector.
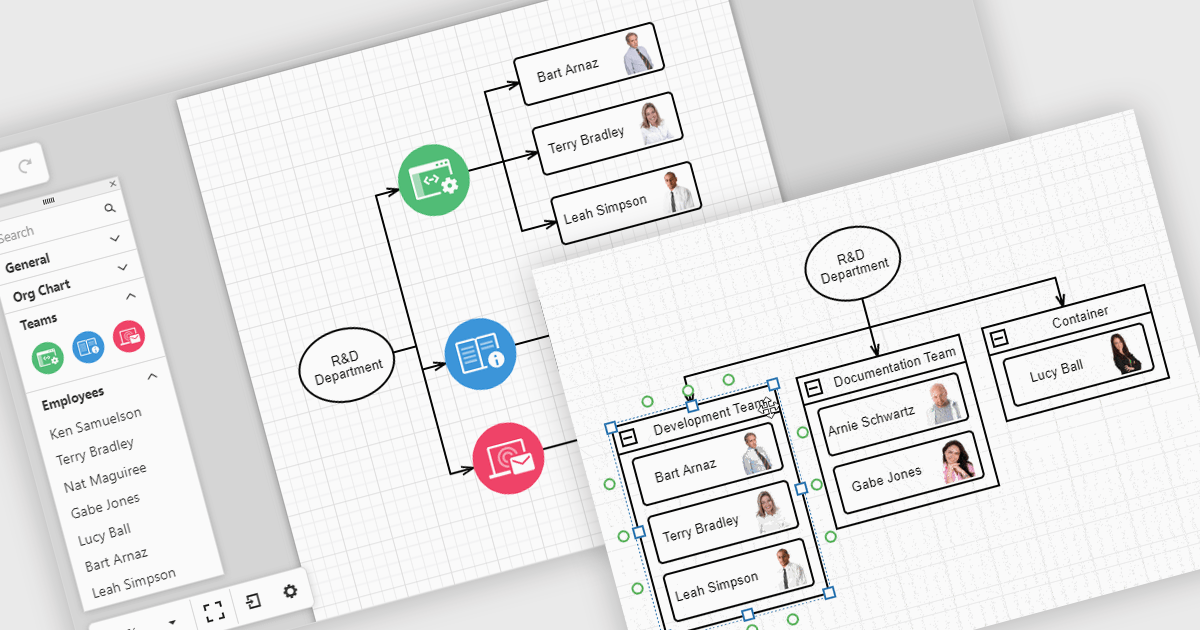
Diagrams in UI toolkits help turn complex data into easy-to-understand visuals that teams can interact with. For example, organizational charts show company structures and reporting lines in a layout that can be updated automatically from HR data. These charts can be expanded, collapsed, or reorganized with drag-and-drop tools, making it easier to understand team relationships and keep information up to date. Diagrams can also be used for workflows, decision trees, and network maps, giving teams a clear, flexible way to present and manage information.
Several React UI suites offer diagram controls including:
For an in-depth analysis of features and price, visit our React UI suite comparison.

Built-in theme support in a React grid refers to the component's ability to natively integrate and adapt to predefined visual styles without requiring extensive custom CSS. This feature allows developers to quickly apply consistent, professional-looking designs that align with widely used UI frameworks such as Material UI, Bootstrap, or custom enterprise branding. It simplifies the process of maintaining visual consistency across applications, reduces front-end development time, and ensures that the grid remains visually coherent with the rest of the user interface, particularly during updates or when switching between themes.
Several React Grid controls offer support for built-in themes including:
For an in-depth analysis of features and price, visit our comparison of React Grid controls.
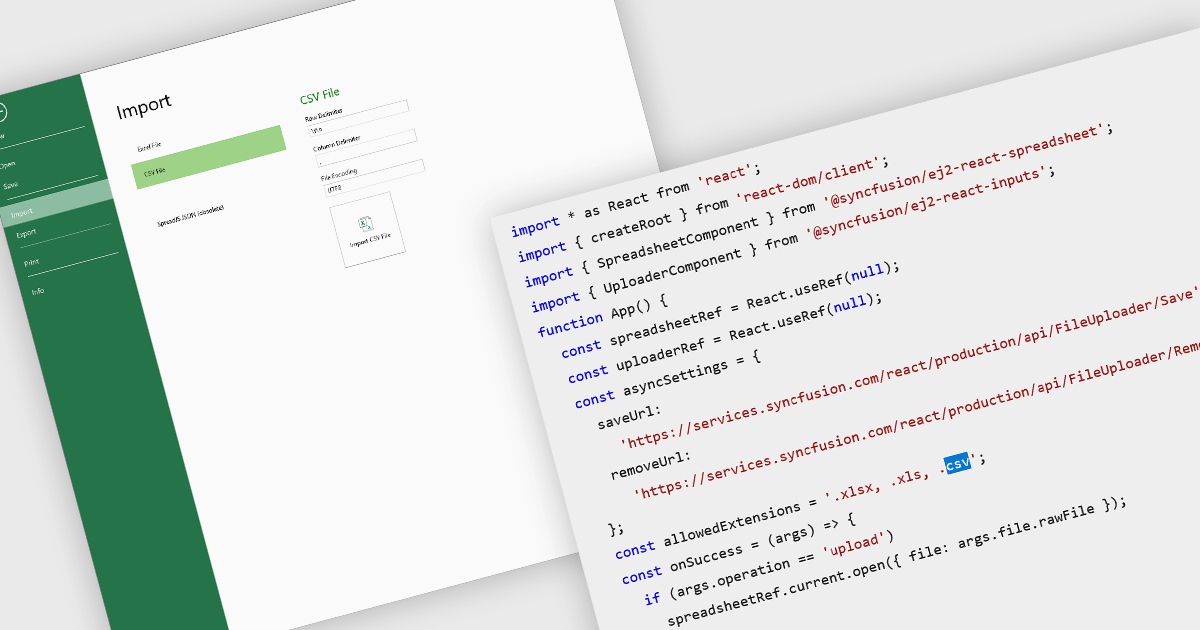
Importing CSV files in spreadsheet components allows developers and end-users to load tabular data from simple text-based formats into an interactive grid. The feature typically supports reading CSV with various delimiters, optional headers, and options about how to treat quoted text, line endings, and text formatting. It provides a bridge between raw data sources (spreadsheets exported from other tools, logs, exports from databases) and richer in-browser or in-application editing, formatting, analysis, or further exporting. For many applications, being able to accept CSV imports is essential for interoperability, ease of data ingestion, and enabling users without deep technical skills to bring their data into a system.
Several React spreadsheet controls offer the ability to import CSV files including:
For an in-depth analysis of features and price, visit our React spreadsheet controls comparison.
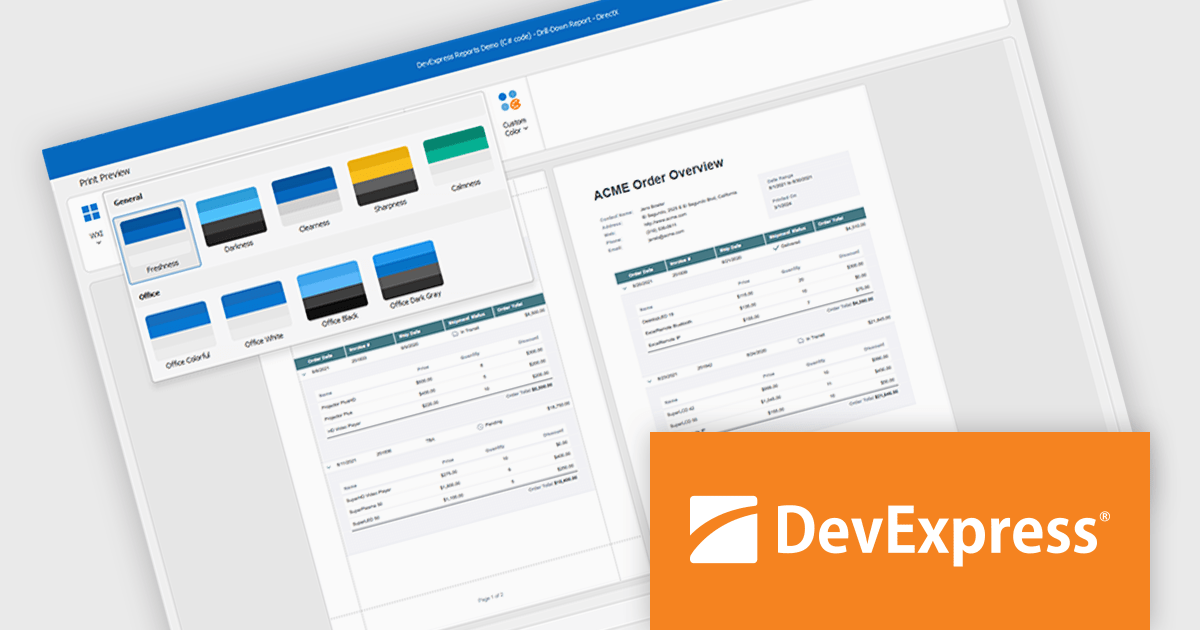
DevExpress DXperience is a comprehensive development suite that enables developers to build high-performance applications for Windows, Web, mobile, and tablet platforms using a unified set of controls and tools. It includes hundreds of desktop UI controls for WinForms, WPF, and reporting, as well as web UI controls for Blazor, ASP.NET, MVC, Core, Bootstrap Web Forms, JavaScript, Angular, React, Vue, and web reporting, plus productivity tools like XPO ORM and CodeRush for Visual Studio. With its extensive component library, DXperience accelerates development, ensures visually consistent and responsive interfaces, and is ideal for creating enterprise applications, data-driven web apps, dashboards, and reporting solutions.
DevExpress DXperience enhances application development with new app-wide themes and skins, allowing developers to apply a consistent, modern visual style across entire projects with minimal configuration. By providing professionally designed themes that align with Microsoft Office and Windows 11 aesthetics, along with built-in tools for customizing these designs, it improves the UI design process and reduces the need for manual styling. This enables developers to focus on functionality while delivering polished, cohesive user interfaces that improve usability and maintain a professional appearance across all application modules.
DevExpress DXperience is licensed per developer and is available as a Perpetual License with a 12 month support and maintenance subscription. See our DevExpress DXperience licensing page for full details.
For more information, visit our DevExpress DXperience product page.
電話: (888) 850 9911
Fax: +1 770 250 6199


