













公式サプライヤー
公式および認定ディストリビューターとして200社以上の開発元から正規ライセンスを直接ご提供いたします。
当社のすべてのブランドをご覧ください。
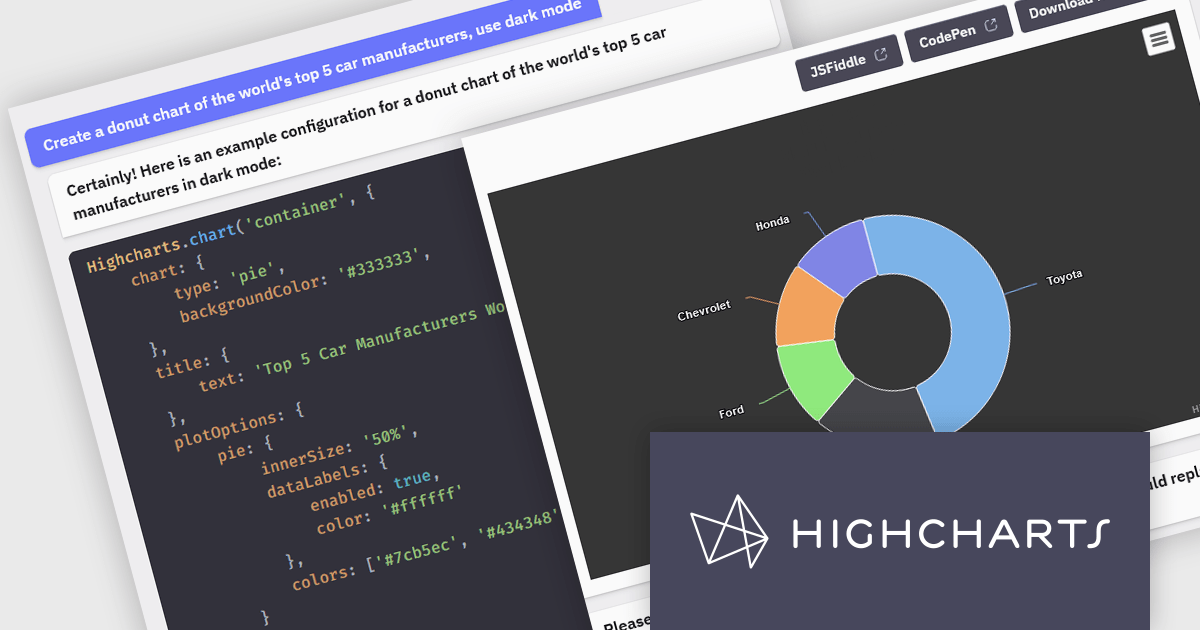
Highcharts is a JavaScript charting framework that allows web developers and data analysts to generate dynamic, visually appealing charts and graphs for websites and web applications. It can display a variety of chart types, including line, spline, area, column, bar, pie, scatter, and many more. Highcharts is well-known for its ease of use, rich documentation, and ability to handle huge datasets efficiently. Features include responsive design, accessibility support, and cross-browser compatibility. Its customization capabilities allow users to create bespoke data visualizations that increase engagement and provide insightful data presentations.
The Highcharts GPT add-on (powered by ChatGPT), and GitHub Copilot support in Highsoft products provide software developers with significant productivity enhancements by integrating AI-driven code assistance directly into their workflow. The Highcharts GPT add-on leverages natural language processing to generate and customize complex chart configurations, reducing the time and effort required for manual coding and enabling developers to focus on higher-level design and functionality. GitHub Copilot integration further streamlines development by offering intelligent code completions and suggestions, facilitating rapid prototyping and error reduction. Together, these Artificial Intelligence tools enhance coding efficiency, improve accuracy, and accelerate the development of sophisticated data visualizations.
For more information see the Highcharts GPT and Highcharts + Github Copilot blog posts.
Highcharts Core is licensed on an annual or perpetual basis, OEM licenses, and Advantage Renewals. It is licensed per Developer and has several license options including Internal, SaaS, SaaS+, and Self Hosted. See our Highcharts Core licensing page for full details.
Learn more on our Highcharts Core product page.
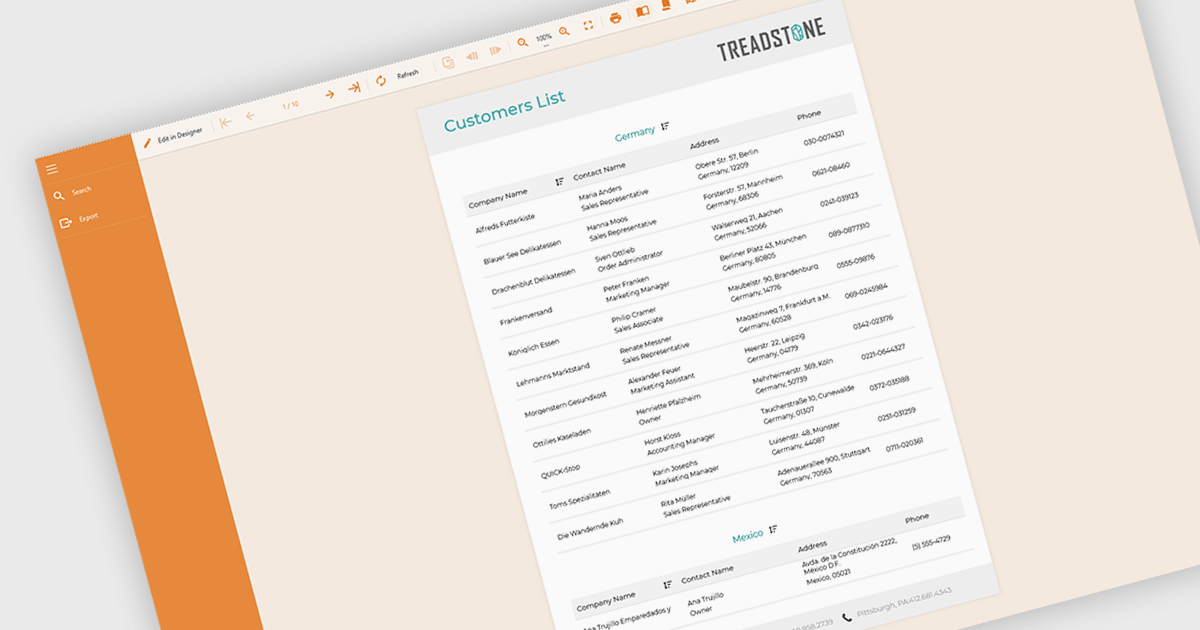
Filtering and grouping report data empowers users to drill down into specific details and identify trends. By filtering data based on relevant criteria, users can isolate subsets of information, while grouping organizes data points based on shared characteristics, allowing for comparisons and pattern recognition within the larger dataset. This combined functionality fosters a deeper understanding of the information being presented.
Several Angular reporting controls offer the ability to filter and group data including:
For an in-depth analysis of features and price, visit our Angular reporting controls comparison.
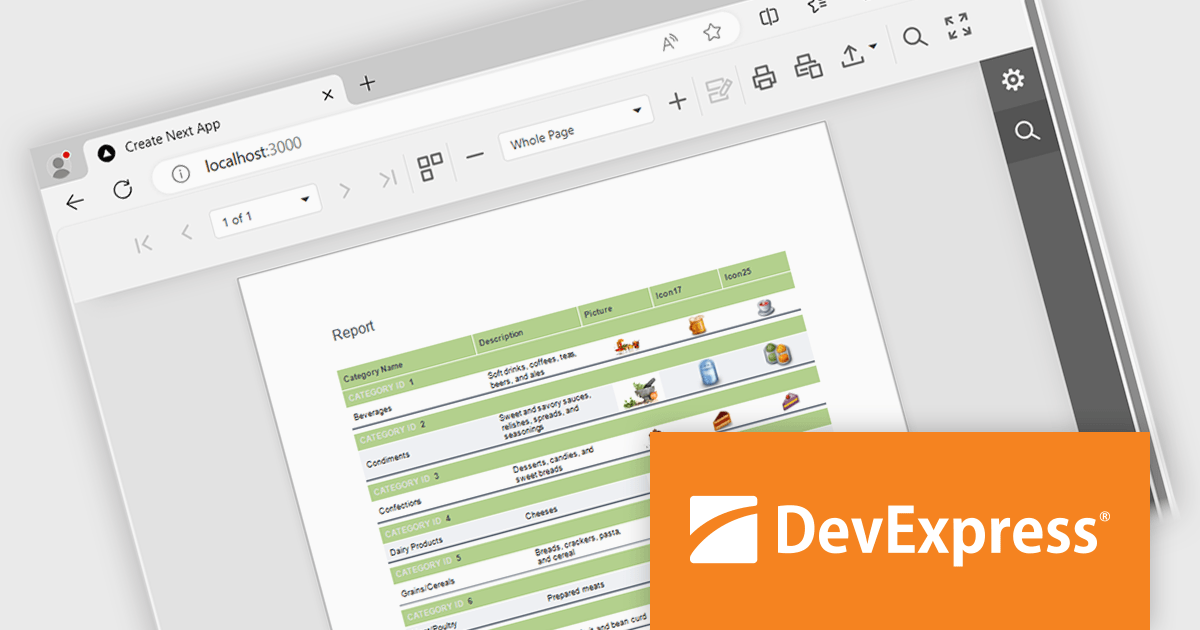
DevExpress Reporting is a powerful, versatile tool for building reports in the .NET ecosystem. It lets you design professional-looking reports with a visual editor, connect to various data sources, and customize them with charts, graphs, and interactive elements. Whether you're creating invoices, sales summaries, or complex dashboards, DevExpress Reporting offers the flexibility and features to bring your data to life in a clear and insightful way. It integrates seamlessly with WinForms, WPF, Web, and Blazor applications, making it a popular choice for developers who need a robust reporting solution.
The DevExpress Reporting 24.1 release introduces a native React Report Viewer component that streamlines the integration of reporting into React applications. This new component leverages the proven architecture of the DevExpress Angular Report Viewer, eliminating the need for JavaScript wrappers and ensuring a more responsive and performant user experience. This translates to benefits like faster rendering and a more intuitive user interface for interacting with reports within React applications, making it ideal for scenarios requiring seamless report viewing and interaction within complex React dashboards or data analysis tools.
To see a full list of what's new in version 24.1, see our release notes.
DevExpress Reporting is licensed per developer and is available as a Perpetual License with a 12 month support and maintenance subscription. See our DevExpress Reporting licensing page for full details.
DevExpress Reporting is available to buy in the following products:
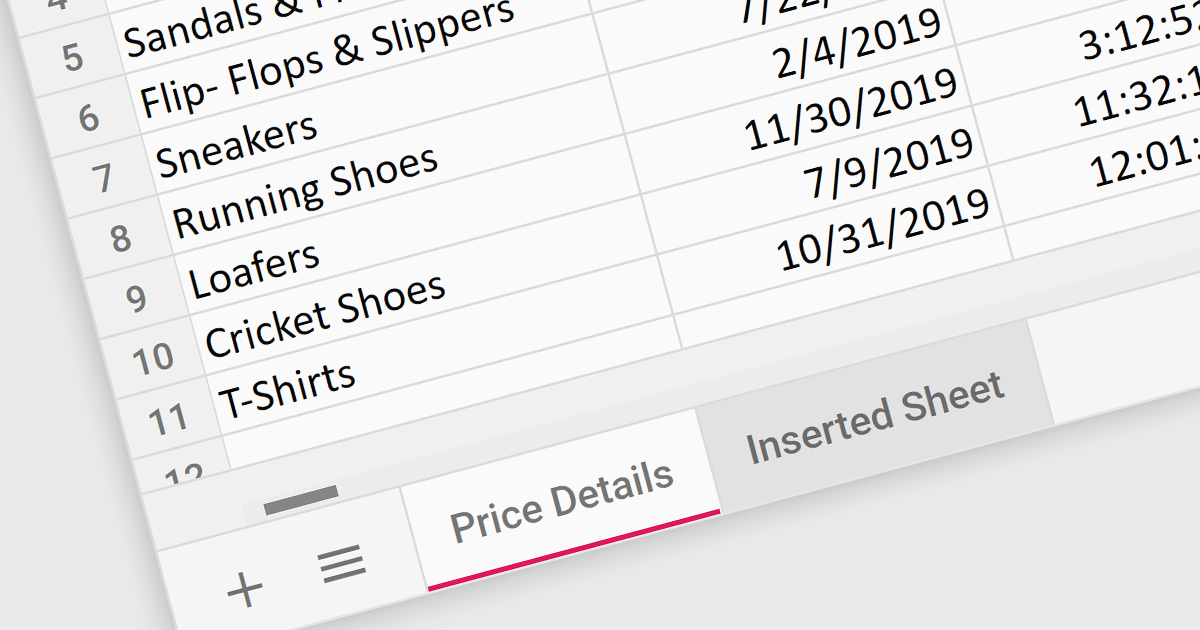
Worksheet tabs act as a visual and interactive index, enabling users to seamlessly navigate between distinct sections within a single workbook. This efficient organization facilitates data comparison and analysis. The clear visual distinction between tabs reduces cognitive load and enhances comprehension, making it easier for users to grasp the overall structure and navigate the information within the workbook.
Several React Spreadsheet controls offer support for tabs including:
For an in-depth analysis of features and price, visit our React Spreadsheet controls comparison.
SpreadJS by MESCIUS is a JavaScript library offering a comprehensive spreadsheet solution for enterprise web applications. It delivers an Excel-like user experience with features like data tables, extensive charting, formatting options, and a powerful formula engine supporting over 500 functions. SpreadJS integrates with popular frameworks like React, Angular, and Vue.js, enabling developers to build high-performance, customizable spreadsheet functionalities within their web applications.
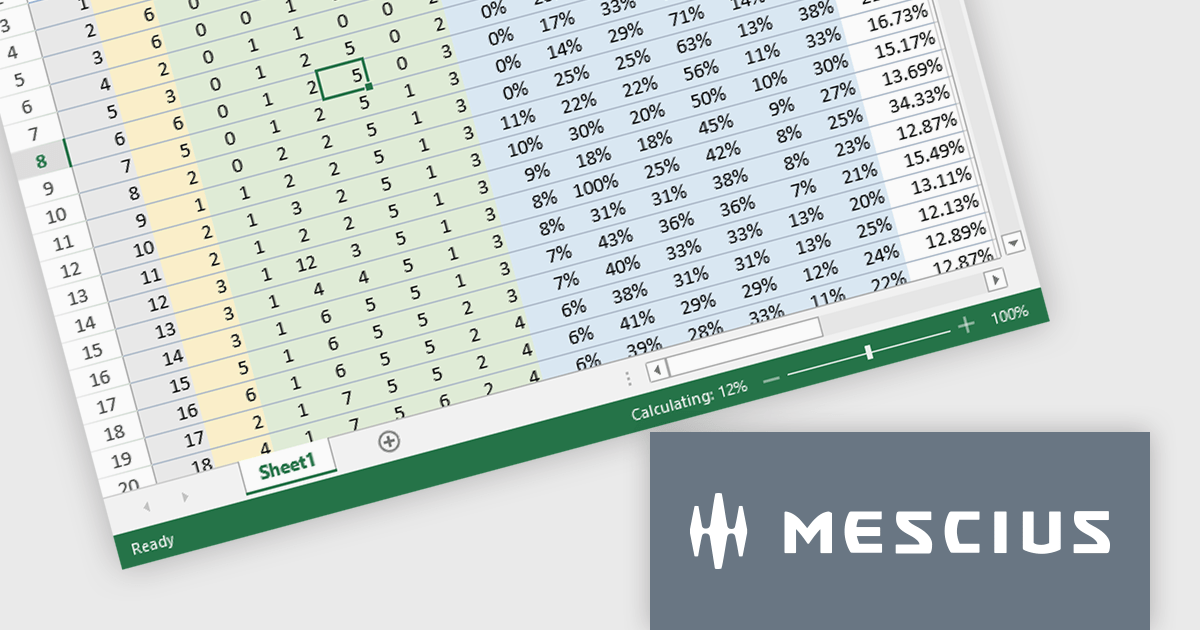
The SpreadJS v17.1 release enables incremental computation, which breaks down the entire calculation into pieces during execution. This enables responsiveness to user actions when the calculation task is large, preventing the UI from being unresponsive when a workbook has many formulas. Developers will only need to set the incrementalCalculation attribute of the Workbook class to true. This computation procedure is also displayed in the status bar.
To see a full list of what's new in 17.1.0, see our release notes.
SpreadJS is licensed per developer and includes 1 Year Maintenance (major and minor version releases and unlimited support phone calls). SpreadJS requires an Annual or Perpetual Deployment License. The optional Add-ons are available at an additional cost, and require a SpreadJS license. See our SpreadJS licensing page for full details.
Learn more on our SpreadJS product page.
電話: (888) 850 9911
Fax: +1 770 250 6199


