


公式サプライヤー
公式および認定ディストリビューターとして200社以上の開発元から正規ライセンスを直接ご提供いたします。
当社のすべてのブランドをご覧ください。
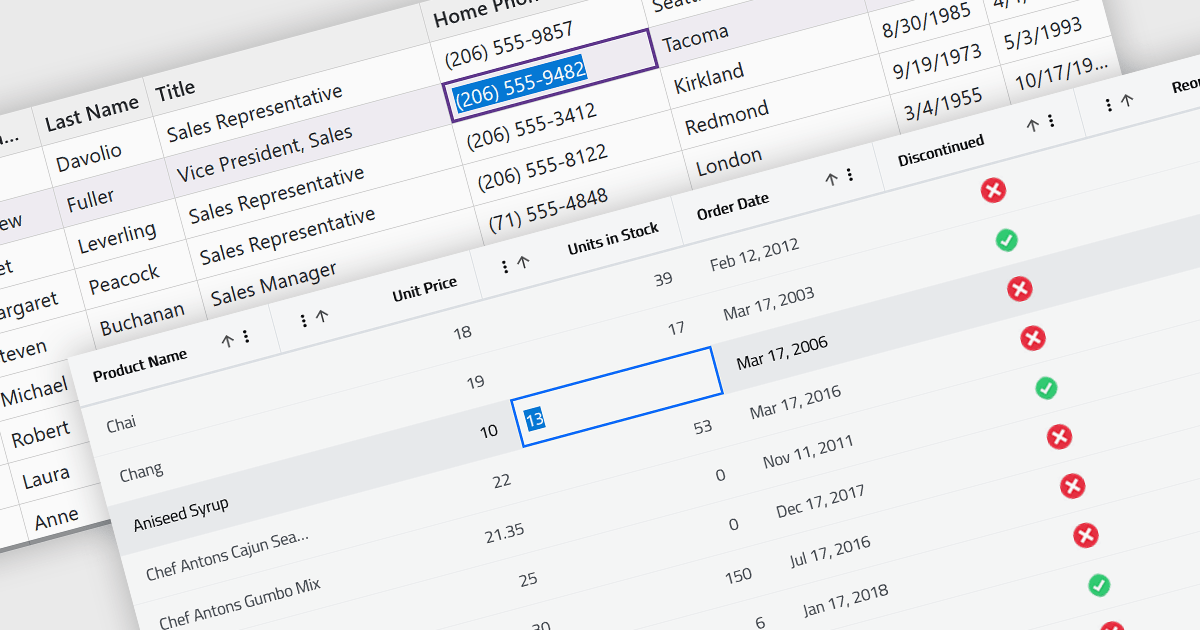
Inline editing in a grid is a user-friendly feature that allows users to edit data directly within the grid interface, without needing to open separate forms or dialogs. This means that data can be modified in place, streamlining workflows by reducing the steps required to make updates. Inline editing is particularly beneficial in scenarios where users need to quickly edit multiple records, such as updating inventory quantities, modifying project statuses, or correcting data errors in real time. By providing immediate visual feedback and maintaining the context of the data set, inline editing enhances productivity and minimizes the risk of disruptions. It is commonly used in applications like content management systems, project management tools, and enterprise resource planning (ERP) systems where efficiency and ease of use are critical.
Several Blazor grid controls offer support for inline editing including:
For an in-depth analysis of features and price, visit our Blazor grid controls comparison.
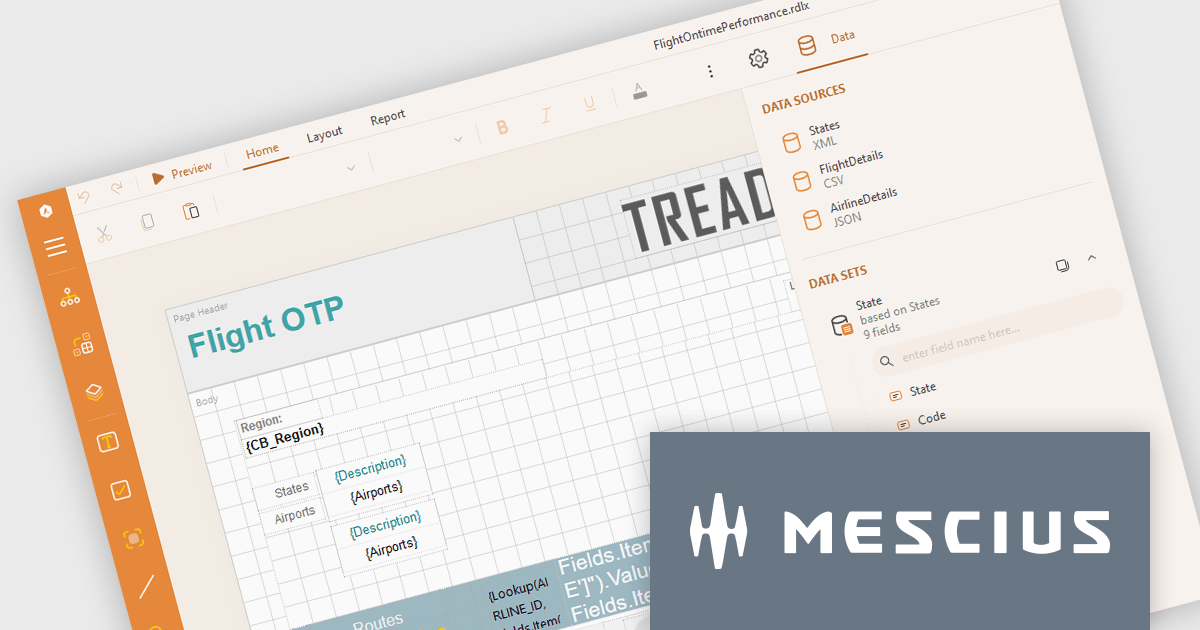
ActiveReports.NET from MESCIUS, is a comprehensive reporting solution for developers building applications in .NET. It empowers you to design and deliver visually appealing reports through user-friendly designers and a wide range of controls. ActiveReports simplifies report creation and distribution with a versatile API, rich data source connectivity, and support for multiple export formats. This translates to increased developer productivity and improved end-user experience with powerful reporting functionalities within your .NET applications.
The ActiveReports.NET v18.2 update enhances the XML Data Display in the Web Designer by introducing a tree structure for data fields, making it significantly easier to navigate and understand complex XML data. This intuitive format allows developers to quickly explore hierarchical data structures, streamlining the data binding process and reducing the effort required to interpret XML data. As a result, developers can focus more on designing reports efficiently rather than spending time deciphering the data itself, leading to a more productive and user-friendly report development experience.
To see a full list of what's new in 18.2, see our release notes.
ActiveReports.NET is licensed per developer and is available with or without a 12 month support and maintenance subscription. See our ActiveReports.NET licensing page for full details.
Learn more on our ActiveReports.NET product page.
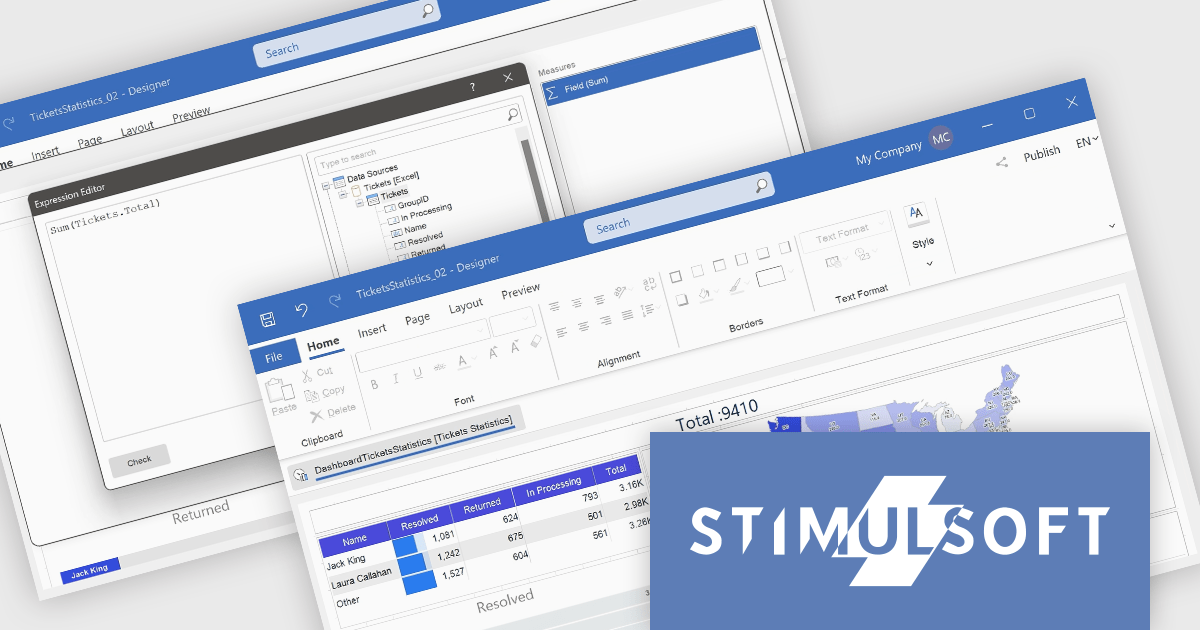
Stimulsoft Dashboards.WEB is a versatile suite of tools for crafting interactive data visualizations for web and desktop applications. It empowers developers to embed intuitive dashboards across various platforms, using the platform-specific components or a centralized cloud designer. With rich data analysis elements, extensive customization options, and pre-built templates, Stimulsoft Dashboards helps you transform complex data into clear, actionable insights for any audience.
The Stimulsoft Dashboards.WEB 2024.4.1 release adds the ability to create Measures within the Text dashboard element, which significantly enhances the flexibility and functionality of dashboards by allowing users to dynamically incorporate calculated values into text elements. This feature enables more informative and contextualized reports, as users can seamlessly display and update relevant metrics directly within the text, eliminating the need for separate data visualization components. This not only streamlines dashboard creation but also improves data accessibility and understanding for end-users.
To see a full list of what's new in 2024.4.1, see our release notes.
Stimulsoft Dashboards.WEB is licensed per developer and is available as a perpetual license with 1 year support and maintenance. See our Stimulsoft Dashboards.WEB licensing page for full details.
Stimulsoft Dashboards.WEB is available in the following products:
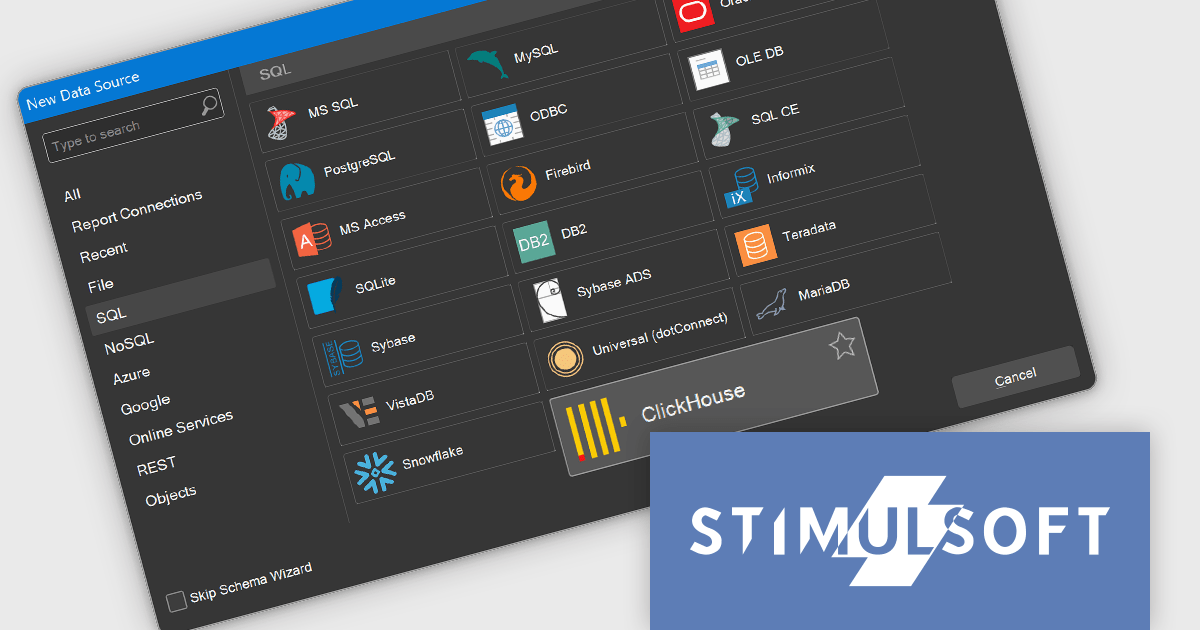
Stimulsoft Reports.WEB is a cross-platform reporting solution designed for integration within web applications. It leverages a client-server architecture for report generation, viewing, printing, and exporting directly in web browsers. Its powerful .NET report engine offers efficient report processing, a user-friendly HTML5 report designer for building reports with various data sources and visualizations, and an interactive HTML5 viewer for seamless report display within web applications. This integration allows developers to implement robust reporting functionalities without browser plugins or additional client-side dependencies.
The Stimulsoft Reports.WEB 2024.4.1 release adds the ability to connect to the ClickHouse online data storage and exchange service directly from the report designer. This eliminates the need for complex data extraction and transformation processes, streamlining the reporting workflow and improving efficiency. By connecting to ClickHouse, users can leverage its powerful analytical capabilities and real-time data processing features to generate dynamic and informative reports.
To see a full list of what's new in 2024.4.1, see our release notes.
Stimulsoft Reports.WEB is licensed per developer and is available as a perpetual license with 1 year support and maintenance. See our Stimulsoft Reports.WEB licensing page for full details.
Stimulsoft Reports.WEB is available in the following products:

FastReport .NET is a comprehensive reporting solution for .NET applications, offering a wide range of tools for creating, managing, and delivering reports. This software is designed to enable developers to integrate complex reporting functionalities directly into their .NET projects. Key features of FastReport .NET include an intuitive visual report designer, a powerful data processing engine, and support for a variety of export formats such as PDF, Excel, and Word. The product also supports data connectivity from multiple sources, including databases, XML files, and JSON. With its robust scripting capabilities, customizable templates, and ability to generate interactive reports, FastReport .NET provides developers with a versatile toolset for building high-performance, professional-grade reports suitable for business intelligence, data analysis, and presentation needs.
The FastReport .NET 2025.1 update introduces a valuable new feature that allows developers to add a report page as a link, instead of inserting the page into the report. This enhances report modularity and flexibility allowing developers to integrate external report pages into existing reports without duplicating content, simplifying maintenance and updates. By linking report pages, developers can efficiently reuse content across multiple reports, ensuring consistency while reducing the need for repetitive configuration. This feature is particularly advantageous for complex reporting scenarios where maintaining a single source of truth is essential.
To see a full list of what's new in 2025.1, see our release notes.
FastReport .NET is licensed per named user with options for Single, Team or Site Licenses. See our FastReport .NET Component Packages licensing page for full details.
Learn more on our FastReport .NET Component Packages product page.
電話: (888) 850 9911
Fax: +1 770 250 6199


