


公式サプライヤー
公式および認定ディストリビューターとして200社以上の開発元から正規ライセンスを直接ご提供いたします。
当社のすべてのブランドをご覧ください。
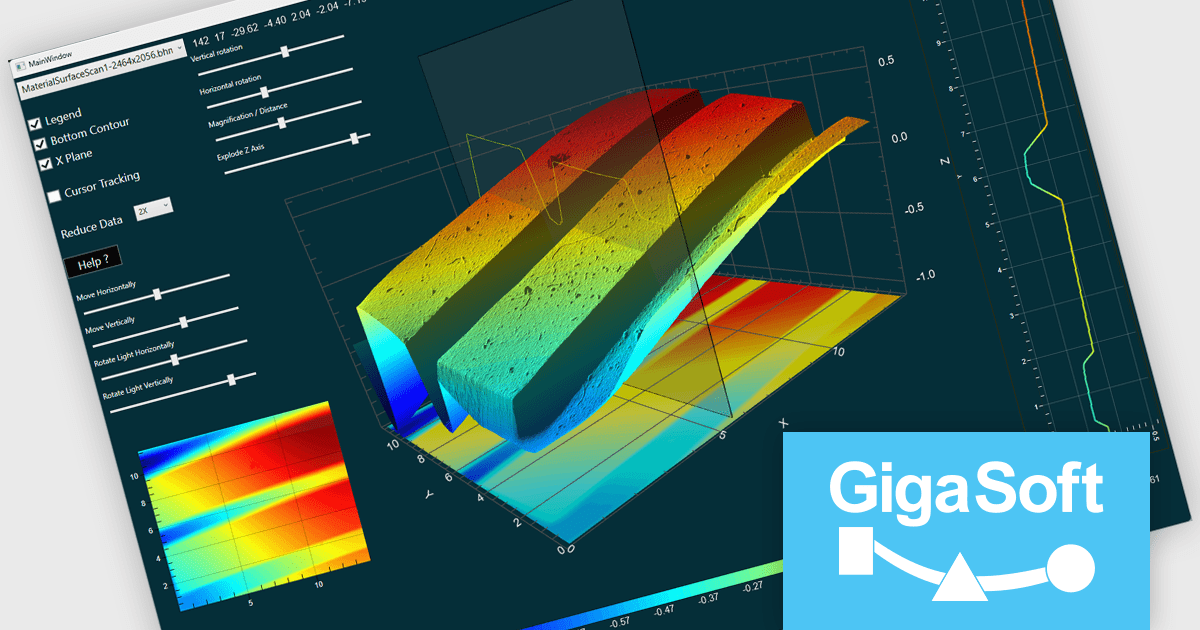
Gigasoft ProEssentials is a robust charting library for Windows development, providing a wide array of 2D and 3D chart types. The product offers a versatile suite of components, such as Graph, Scientific Graph, and 3D Scientific Graph, enabling the creation of sophisticated visualizations. It's extensive support for various platforms and development environments, including WPF, WinForm, and integration with popular IDEs like Visual Studio, enhances flexibility and empowers developers to efficiently visualize data within their applications.
The Gigasoft ProEssentials provides Direct3D rendering, significantly enhancing scene construction performance. By leveraging the parallel processing power of the GPU, this feature accelerates the rendering process compared to traditional CPU-based methods. This results in faster visualization of complex scenes, improved responsiveness, and a more efficient use of system resources, ultimately enabling developers to create more performant and visually impressive applications.
Gigasoft ProEssentials is licensed per developer and is available as a perpetual license with free technical support and maintenance for the life of the version. See our Gigasoft ProEssentials licensing page for full details.
For more information, visit our Gigasoft ProEssentials product page.
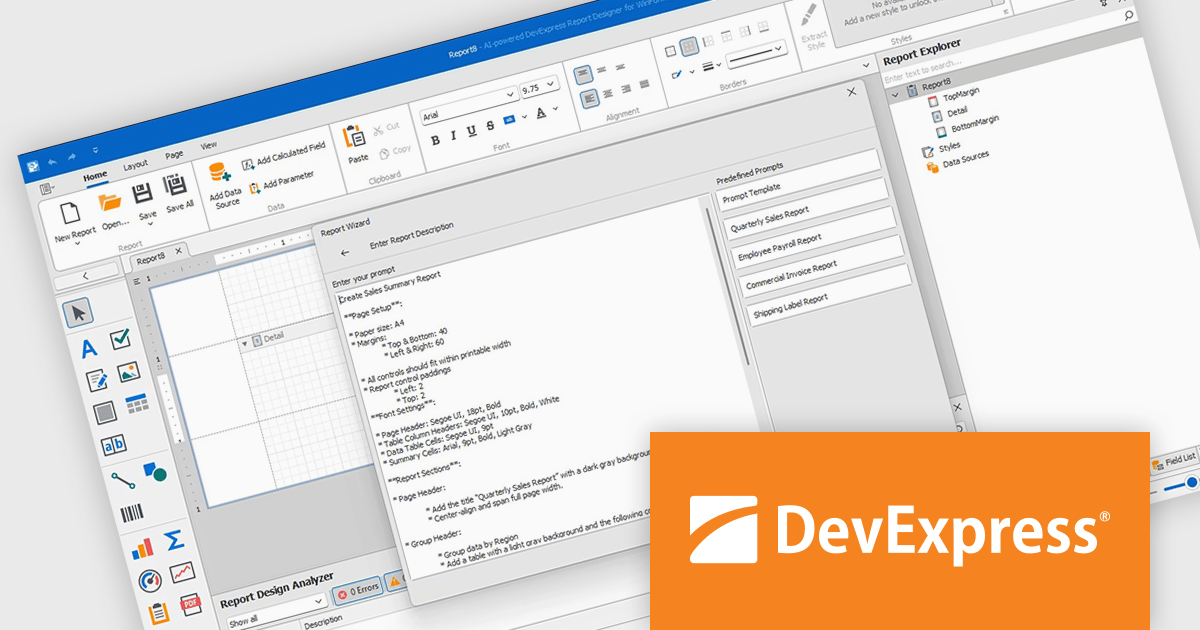
DevExpress Reporting is a comprehensive suite of reporting tools that empowers developers to create visually stunning and highly customizable reports for various applications. With its rich feature set, including data binding, layout design, printing, and exporting capabilities, DevExpress Reporting enables the efficient creation of reports that meet the most demanding business requirements.
The DevExpress Reporting v25.1 update introduces a new AI-powered Report Wizard (currently in Community Technology Preview), bringing natural language capabilities directly into the report design workflow. By allowing users to describe the report they need in plain text, the wizard interprets this input and automatically generates a matching report layout. This greatly reduces the time and expertise required to design reports, particularly for users who may not be familiar with the underlying report schema or expression syntax. It’s especially useful for quickly prototyping reports or enabling non-technical users to contribute to report design without writing code or manually configuring elements.
To see a full list of what's new in version 25.1, see our release notes.
DevExpress Reporting is licensed per developer and is available as a Perpetual License with a 12 month support and maintenance subscription. See our DevExpress Reporting licensing page for full details.
DevExpress Reporting is available to buy in the following products:
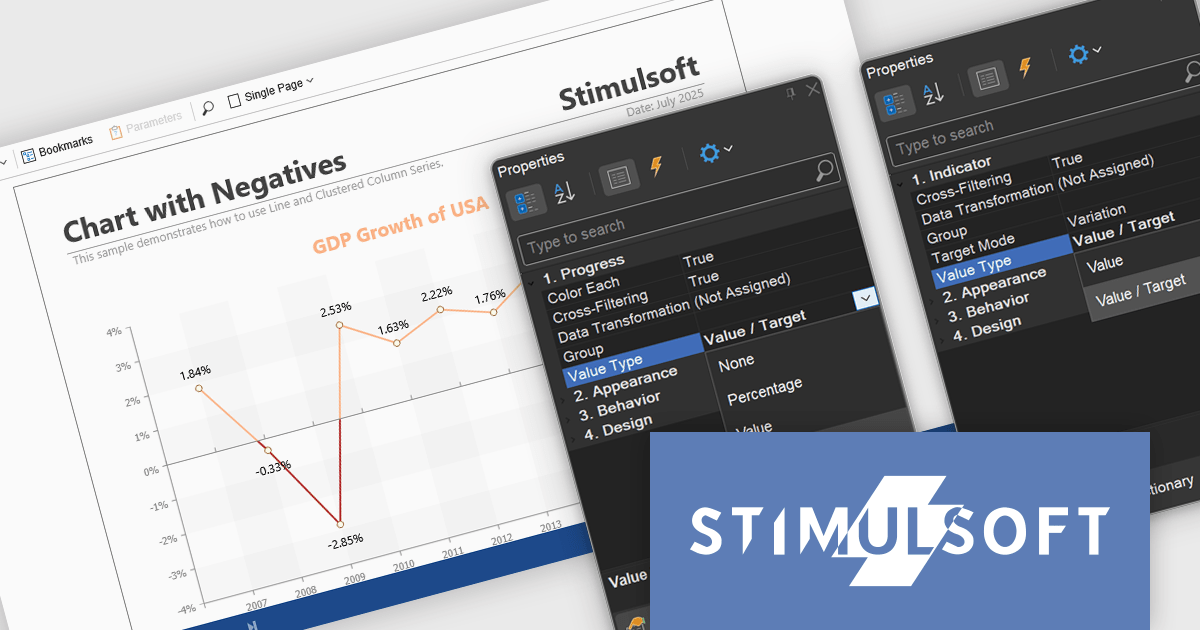
Stimulsoft Reports.NET is a reporting tool that empowers developers to design, edit, view, export, and print reports of varying complexity. It features a user-friendly report designer and an interactive viewer, allowing connection to various data sources. The generated reports can be seamlessly integrated into both Windows Forms and ASP.NET applications, with export capabilities to numerous formats for maximum flexibility.
The Stimulsoft Reports.NET 2025.3.1 update enhances the Value Type property by allowing developers to customize how values are displayed in Progress and Indicator dashboard elements. Progress elements can now show raw values, percentages, or value and target pairs, while Indicator elements support raw values or value and target formats. This added flexibility helps developers present data in the most relevant format for their users, improving clarity and making dashboards more informative and purpose-driven.
To see a full list of what's new in 2025.3.1, see our release notes.
Stimulsoft Reports.NET is licensed per developer and is available as a perpetual license with 1 year support and maintenance. See our Stimulsoft Reports.NET licensing page for full details.
Stimulsoft Reports.NET is available in the following products:
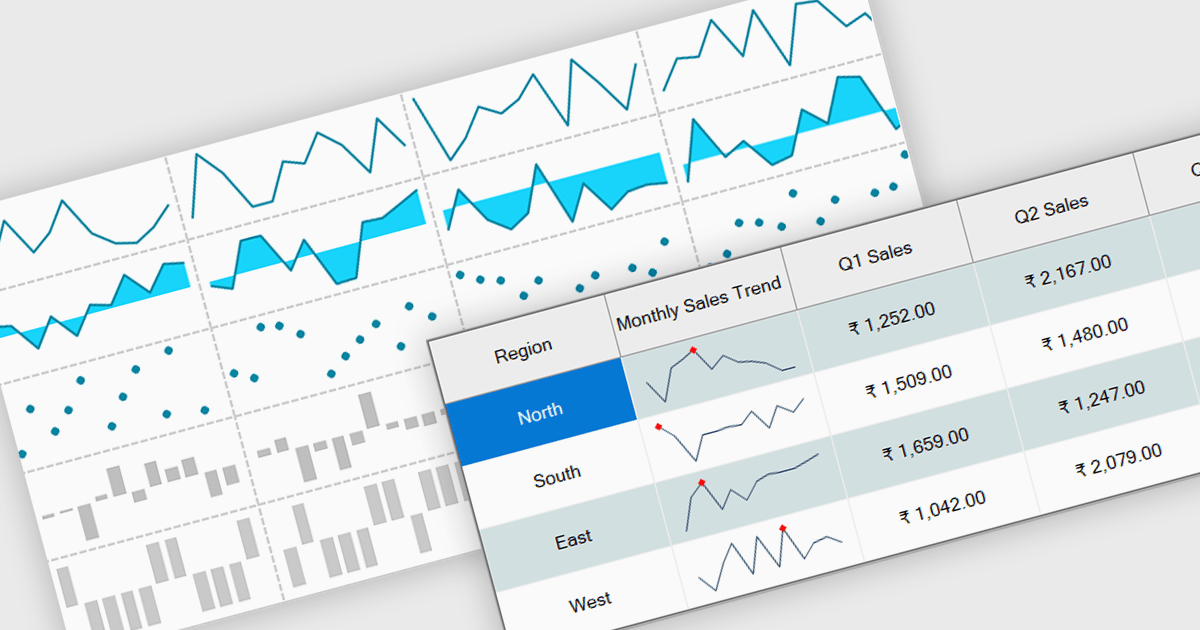
Sparklines are small embedded charts displayed within individual cells of a data grid or table, offering a compact and intuitive way to visualize trends, patterns and variations in data. Unlike traditional charts, sparklines are designed to fit alongside text or numerical values, providing immediate visual context without taking up additional space. This makes them ideal for high density dashboards and reports where space efficiency and quick interpretation are important. By enabling users to scan and compare trends across multiple rows at a glance, sparklines support faster decision making and improved data comprehension. Common use cases include tracking stock performance over time, visualizing monthly sales trends, monitoring temperature fluctuations or comparing website traffic across multiple pages directly within the grid.
Several .NET Winforms grid controls offer support for sparklines including:
Telerik UI for WinForms is a comprehensive UI library offering over 160 versatile controls designed to streamline the development of modern, data-rich desktop applications. With features like built-in High DPI support, extensive customization options, and components ranging from grids and charts to schedulers and rich text boxes, it empowers developers to craft visually appealing and feature-packed Windows Forms applications.
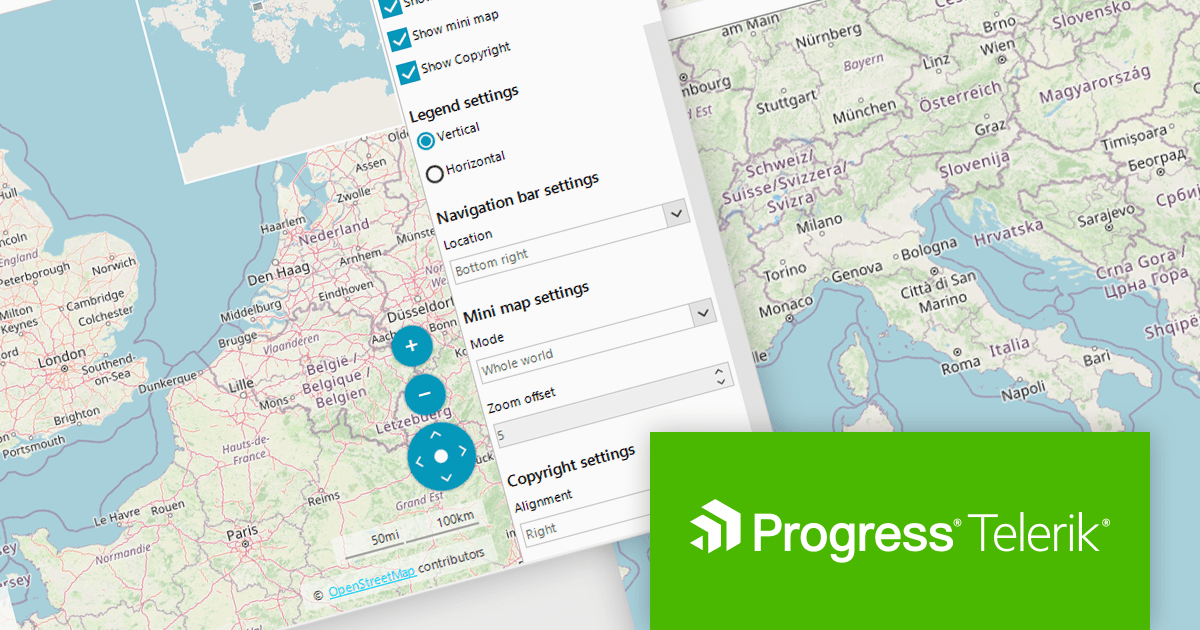
Telerik UI for WinForms includes a customizable copyright label UI element in the RadMap control. This feature enables the display of information such as source attribution or licensing directly on the map surface. This creates trust and supports legal and ethical use of third-party map providers by making attribution visible to end users. Such support enables compliance with common mapping data usage requirements for commercial applications, which is often mandated by services like OpenStreetMap or Bing Maps. By integrating this element into the visual layer of the map, applications can ensure that attribution remains persistent and clearly associated with the displayed geographic content without requiring additional layout adjustments.
Telerik UI for WinForms is licensed per developer and has two licensing models: an annual Subscription License and a Perpetual License. The Subscription license provides access to the latest product updates, technical support, and exclusive benefits for a flat annual fee, and must be renewed to continue using the software. The Perpetual license is a one-time purchase granting access to the current released version and includes a one-year subscription for product updates and technical support. After this initial period, users can choose to renew the subscription element to continue receiving updates and support; otherwise, they may continue using the installed version available during their active subscription term but will forgo future updates and support. See our Telerik UI for WinForms licensing page for full details.
Telerik UI for WinForms is available individually or as part of the following products:
電話: (888) 850 9911
Fax: +1 770 250 6199


