


公式サプライヤー
公式および認定ディストリビューターとして200社以上の開発元から正規ライセンスを直接ご提供いたします。
当社のすべてのブランドをご覧ください。
ComponentOne Studio Enterprise is a comprehensive suite of .NET UI controls developed by MESCIUS (formerly GrapeCity) designed for building rich, interactive desktop, web, and mobile applications. It provides developers with a broad range of tools and components-including data grids, charts, reports, input controls, and advanced data visualization features-for platforms such as WinForms, WPF, ASP.NET Core, Blazor, WinUI, and .NET MAUI. The suite emphasizes performance, flexibility, and ease of integration, helping teams create consistent, feature-rich user experiences across multiple application types while maintaining a unified development approach.
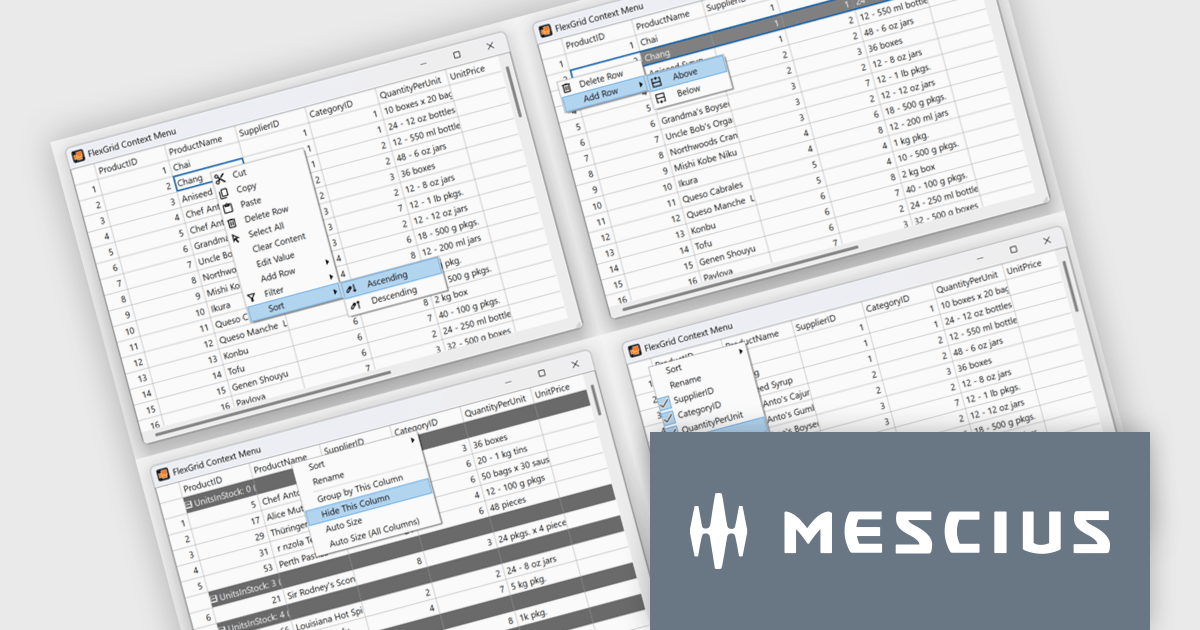
The ComponentOne 2025 v1.2 update includes a new sample demonstrating a complete, custom context menu solution for FlexGrid. It allows developers to define context-aware actions that adapt to different parts of the grid. This enables right-click functionality to insert rows, sort or group columns, and open a column picker directly within the grid. Developers benefit from the flexibility of FlexGrid’s API to implement tailored solutions while providing end users with a familiar, Excel-like experience that enhances efficiency and precision in data management tasks.
To see a full list of what's new in 2025 v1.2, see our release notes.
ComponentOne Studio Enterprise is licensed per developer on a perpetual basis and includes a 12 month subscription. Priority Support is also available. See our ComponentOne Studio Enterprise licensing page for full details.
Learn more on our ComponentOne Studio Enterprise product page.
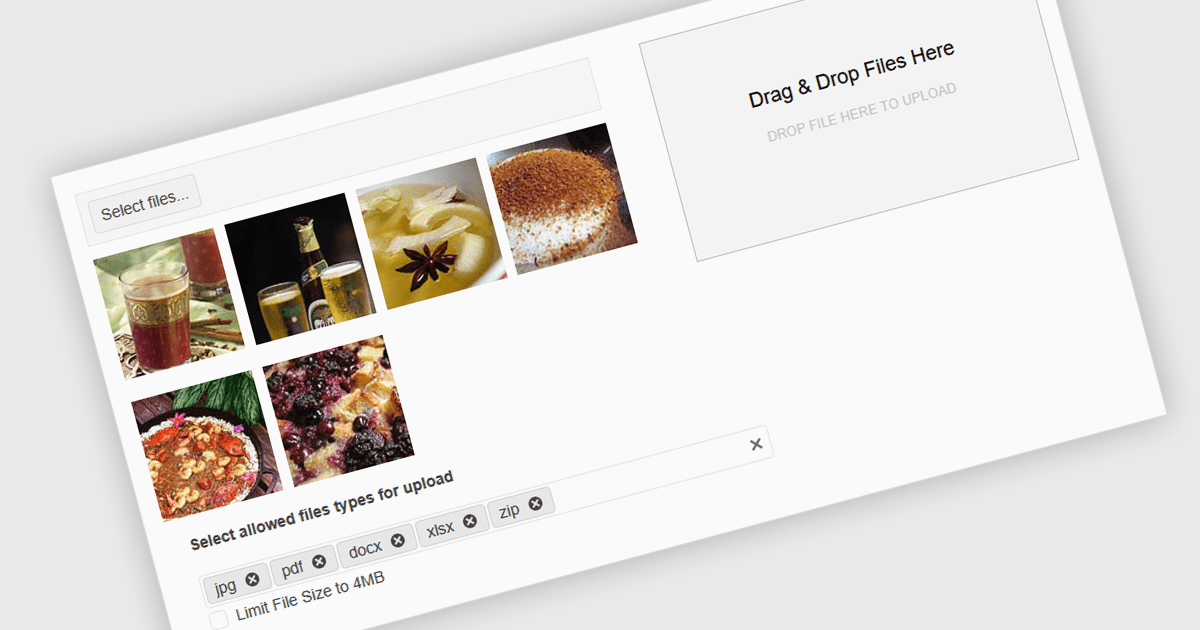
Queuing multiple files for upload in .NET components refers to the ability to stage several files for transfer either sequentially or in parallel, rather than requiring each to be uploaded individually. This capability is especially valuable in applications where users need to upload large sets of files - such as images, documents, or backups - without manually initiating each upload. It enhances efficiency by automating the process, supporting better resource management and enabling features such as progress tracking, retry mechanisms, and batch error handling. When integrated with protocols like FTP (File Transfer Protocol), this feature becomes critical for systems that handle bulk file distribution, content management, or remote data archiving. For instance, a content management system might allow editors to upload an entire gallery at once, while a backup tool could automatically queue system logs for nightly FTP transfer.
Several .NET Comms & Messaging components support queuing multiple files for upload including:
For an in-depth analysis of features and price, visit our comparison of .NET Comms & Messaging components.
DevExpress WinForms is a comprehensive suite of 190+ UI controls and development tools designed for building high-performance desktop applications. It offers a broad array of customizable controls, from data grids and ribbon interfaces to advanced charts, maps, and diagramming components. This empowers developers to rapidly create functionally rich applications, while adhering to accessibility guidelines and touch-enabled technology for modern Windows environments.
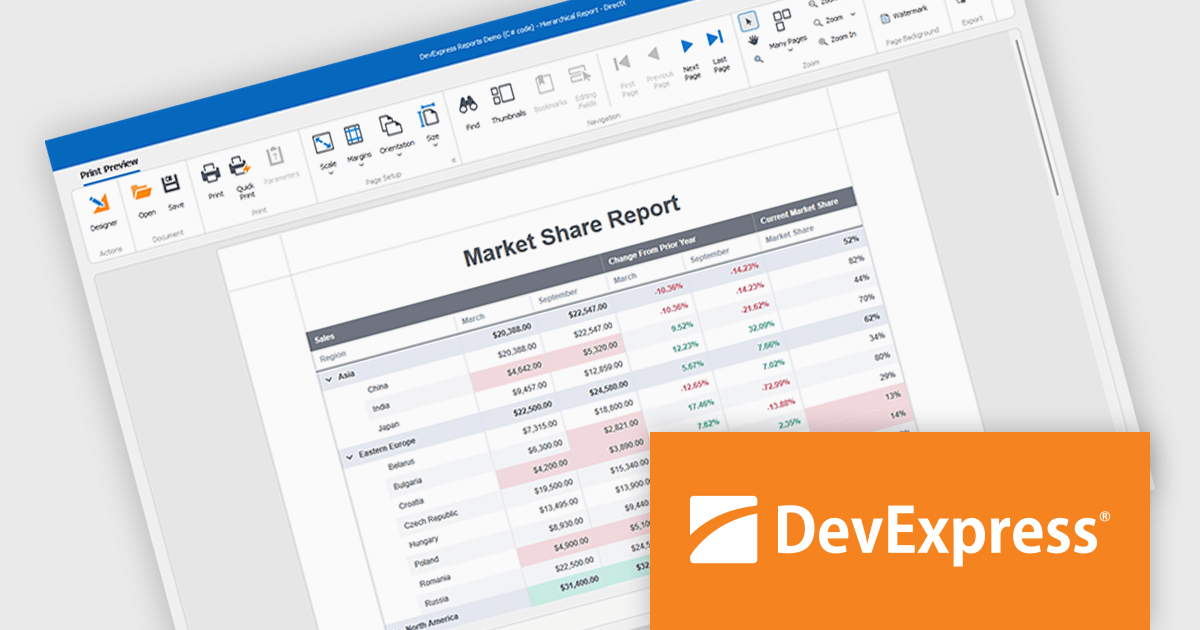
DevExpress WinForms provides advanced analytics in reporting to help developers build data-driven applications that deliver deeper insights. It enables dynamic data shaping, interactive exploration, and precise calculations within reports, allowing developers to incorporate conditional formatting, interactive sorting, filtering, grouping, drill-down navigation, calculated fields, parameters, and real-time summaries to create reports that adapt to user input, highlight key metrics, and support informed decision-making.
DevExpress WinForms is licensed per developer and is available as a Perpetual License with a 12 month support and maintenance subscription. See our DevExpress WinForms licensing page for full details.
DevExpress WinForms is available individually or in the following products:
DevExpress DXperience is a comprehensive development suite that enables developers to build high-performance applications for Windows, Web, mobile, and tablet platforms using a unified set of controls and tools. It includes hundreds of desktop UI controls for WinForms, WPF, and reporting, as well as web UI controls for Blazor, ASP.NET, MVC, Core, Bootstrap Web Forms, JavaScript, Angular, React, Vue, and web reporting, plus productivity tools like XPO ORM and CodeRush for Visual Studio. With its extensive component library, DXperience accelerates development, ensures visually consistent and responsive interfaces, and is ideal for creating enterprise applications, data-driven web apps, dashboards, and reporting solutions.
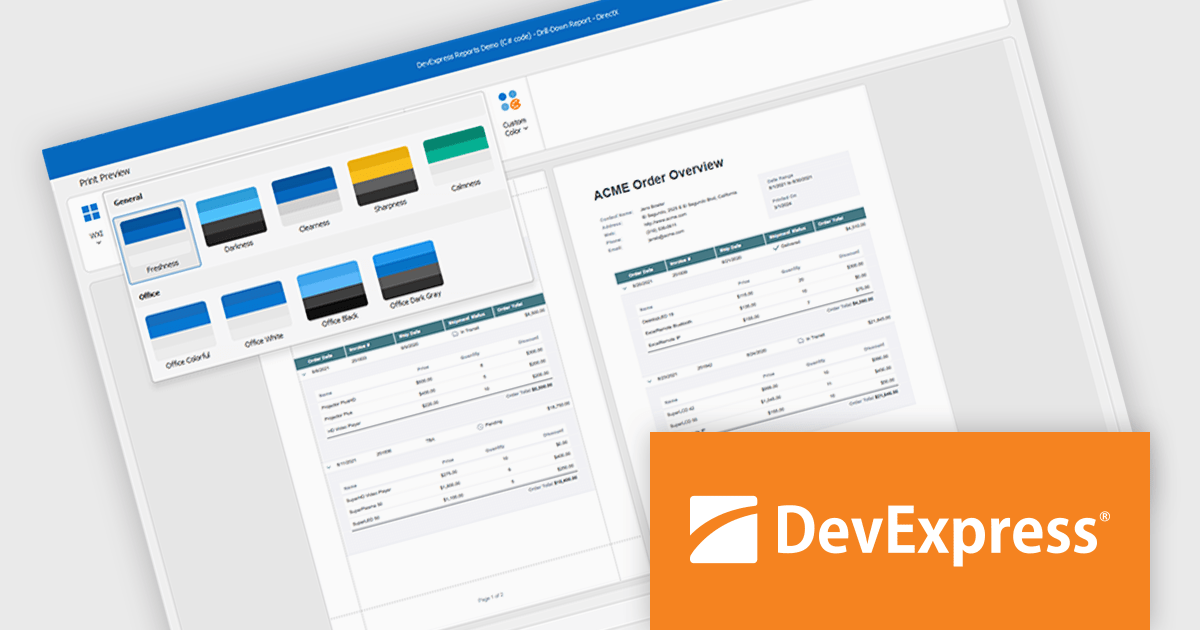
DevExpress DXperience enhances application development with new app-wide themes and skins, allowing developers to apply a consistent, modern visual style across entire projects with minimal configuration. By providing professionally designed themes that align with Microsoft Office and Windows 11 aesthetics, along with built-in tools for customizing these designs, it improves the UI design process and reduces the need for manual styling. This enables developers to focus on functionality while delivering polished, cohesive user interfaces that improve usability and maintain a professional appearance across all application modules.
DevExpress DXperience is licensed per developer and is available as a Perpetual License with a 12 month support and maintenance subscription. See our DevExpress DXperience licensing page for full details.
For more information, visit our DevExpress DXperience product page.
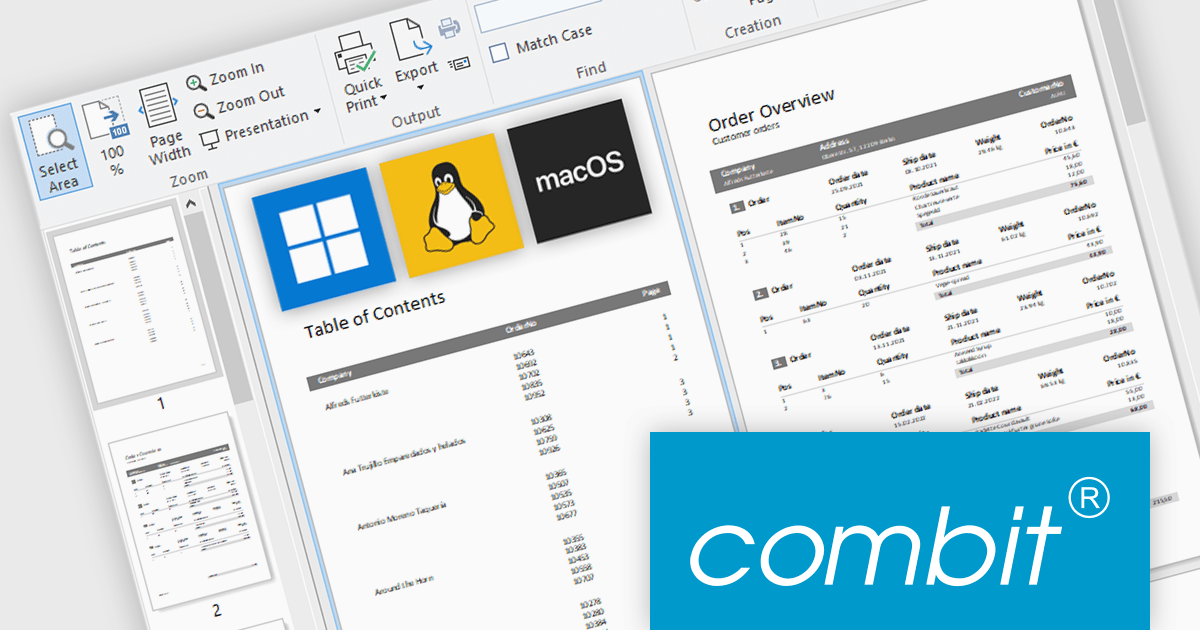
combit have announced an exciting new development for their popular report generator with the introduction of List & Label Cross Platform (LLCP), due for release in October.
This is a significant milestone for combit, as they will now offer a cross-platform reporting solution for Windows, Linux, and macOS. The new powerful print engine is entirely based on the most recent version of .NET, with no native dependencies. For reporting that runs anywhere your app runs.
Features will include:
This cross-platform functionality will only be included as part of the List & Label Enterprise Edition. To help customers benefit from this major advancement, special offers are available until October 9th 2025.
* Subscription terms for free upgrades will not be extended. Special discounted renewal options will be available until October 2026, please contact us for details.
電話: (888) 850 9911
Fax: +1 770 250 6199


