


公式サプライヤー
公式および認定ディストリビューターとして200社以上の開発元から正規ライセンスを直接ご提供いたします。
当社のすべてのブランドをご覧ください。

Telerik UI for WPF and Telerik UI for WinForms are commercial UI suites that help developers build modern, visually appealing and highly functional Windows applications. Telerik UI for WinForms provides more than 160 robust controls with a well designed architecture and CAB support, making it ideal for enterprise line of business, data intensive and internal desktop apps that demand reliability and rapid development. Telerik UI for WPF is tailored for Windows Presentation Foundation and offers high performance, visually rich and highly customizable controls for advanced line of business scenarios. By using these toolsets, teams can deliver engaging user experiences while reducing time to market and long term maintenance effort.
The Telerik 2025 Q4 update for WPF and WinForms introduces AI powered PDF querying and summarization. By allowing users to ask direct questions about PDF content and receive concise, context aware answers, the enhanced PDF Viewer reduces the time spent navigating long contracts, reports and technical documentation. This capability improves information retrieval and adds meaningful value to document heavy applications by enabling faster access to the specific details users need without manual searching or scrolling.
To see a full list of what's new for each product in 2025 Q4, see our Telerik UI for WPF and Telerik UI for WinForms release notes.
Both Telerik UI for WPF and Telerik UI for WinForms are licensed per developer and have two licensing models: an annual Subscription License and a Perpetual License. The Subscription license provides access to the latest product updates, technical support, and exclusive benefits for a flat annual fee, and must be renewed to continue using the software. The Perpetual license is a one-time purchase granting access to the current released version and includes a one-year subscription for product updates and technical support. After this initial period, users can choose to renew the subscription element to continue receiving updates and support; otherwise, they may continue using the installed version available during their active subscription term but will forgo future updates and support. See our Telerik UI for WPF licensing page and Telerik UI for WinForms licensing page for full details.
Telerik UI for WPF and Telerik UI for WinForms are available individually or as part of the following products:
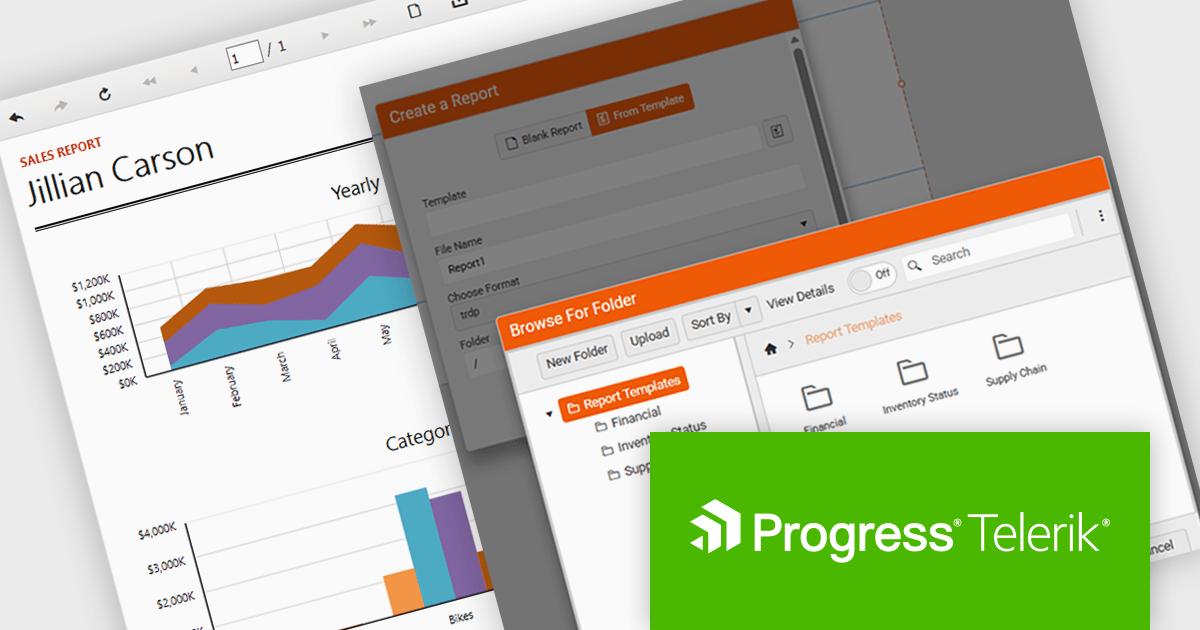
Telerik Reporting is a comprehensive and lightweight embedded reporting tool for .NET web and desktop applications. It enables developers and reporting users to create, design, and export visually appealing, interactive, and reusable reports to effectively present analytical and business data. It supports various technologies, including ASP.NET Core, Blazor, ASP.NET MVC, ASP.NET AJAX, HTML5/JS, Angular, WPF, WinForms, and WinUI.
The Telerik Reporting 2025 Q4 update introduces customizable report templates in the Web Report Designer, giving developers a faster and more controlled way to produce consistent, production-ready reports. By allowing teams to define, save and reuse templates that include predefined layout structures, styling rules and data components, the feature reduces repetitive setup work, maintains uniform design standards across projects and ensures every new report begins with a reliable, compliant foundation.
To see a full list of what's new in 2025 Q4 (19.3.25.1111), see our release notes.
Telerik Reporting is licensed per developer and is available as a perpetual license with a one year support subscription, which is offered in three tiers: Lite, Priority or Ultimate. See our Telerik Reporting licensing page for full details.
Telerik Reporting is available to buy in the following products:
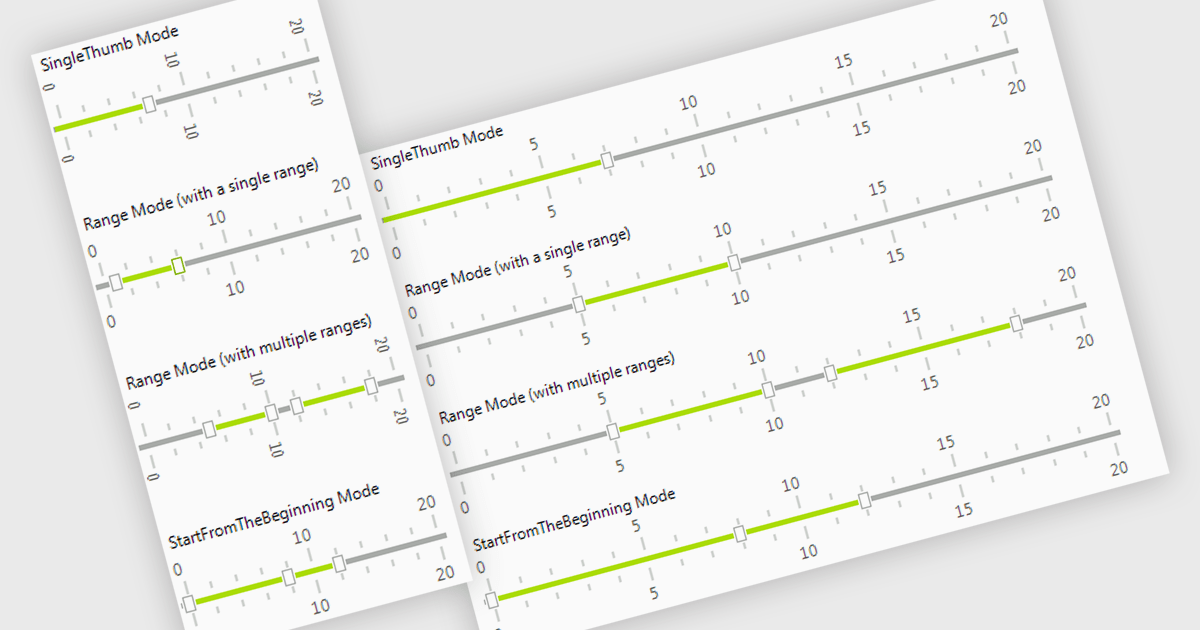
A trackbar in data editors provides a sliding control that allows users to adjust numeric values within a defined range through an interactive visual interface. It reduces the need for manual text entry, prevents invalid inputs by enforcing minimums, maximums and step increments, and offers immediate feedback as values change. Trackbars are especially useful in scenarios where users need to fine tune settings such as selecting volume levels, adjusting brightness, setting filter thresholds or choosing time or price ranges, making them ideal for applications that benefit from quick, intuitive and precise value selection.
Several .NET WinForms components offer Trackbar Data Editors including:
For an in-depth analysis of features and price, visit our comparison of .NET WinForms Data Editors.
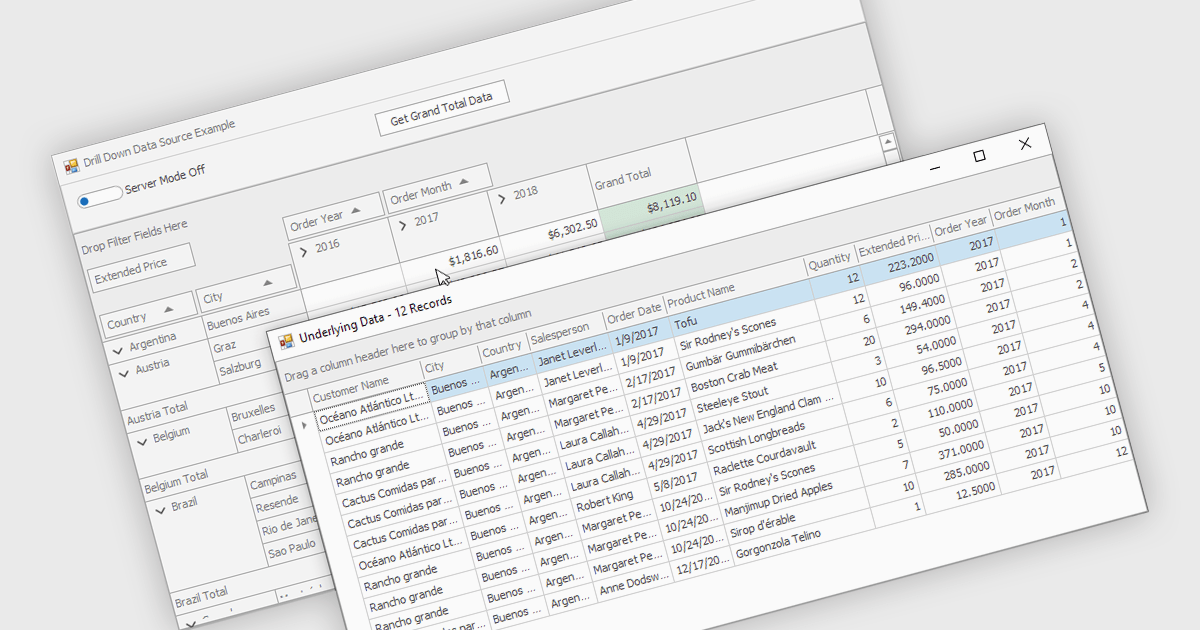
Drill-down capability within a grid control enables users to move from summary data to increasingly detailed records within the same interface, creating a smooth and focused exploration experience. It improves productivity by reducing screen changes and extra queries, helps users spot patterns and exceptions more quickly, and keeps complex information clearly organized. Typical use cases include reviewing sales by region, then by city and customer, analyzing financial summaries that open into individual transactions, or exploring product inventories from category to specific item.
Several .NET WinForms grid controls offer drill-down capability including:
For an in-depth analysis of features and price, visit our .NET WinForms grid controls comparison.
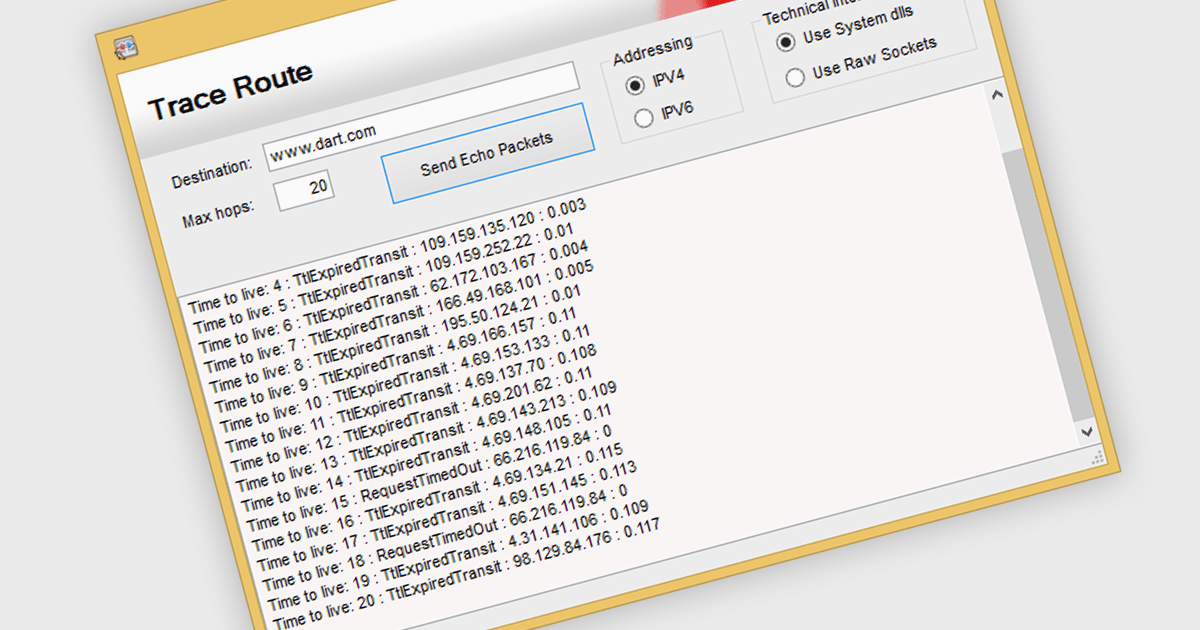
TraceRoute is a network diagnostic protocol used in .NET Communications and Messaging controls to determine the path packets take from the source to a destination across an IP network. It works by sending packets with incrementally increasing Time-To-Live (TTL) values, which prompts routers along the path to return error messages that help identify each hop and measure transit delays. This functionality is particularly useful for monitoring network latency, diagnosing connectivity issues, and understanding the routing behavior of networks in distributed systems. By integrating TraceRoute into a .NET application, developers gain visibility into network paths, enabling more informed troubleshooting and performance optimization of communication processes.
Several .NET Comms & Messaging components offer support for TraceRoute protocol including:
For an in-depth analysis of features and price, visit our comparison of .NET Comms & Messaging.
電話: (888) 850 9911
Fax: +1 770 250 6199


