


公式サプライヤー
公式および認定ディストリビューターとして200社以上の開発元から正規ライセンスを直接ご提供いたします。
当社のすべてのブランドをご覧ください。
DevExpress DXperience is a comprehensive set of UI controls and developer productivity tools for building data-driven desktop and web applications using technologies such as WinForms, WPF, ASP.NET, Blazor and JavaScript, focusing on consistent user experiences, advanced data visualization, reporting, dashboards, and design-time features that support the development and long-term maintenance of complex business applications.
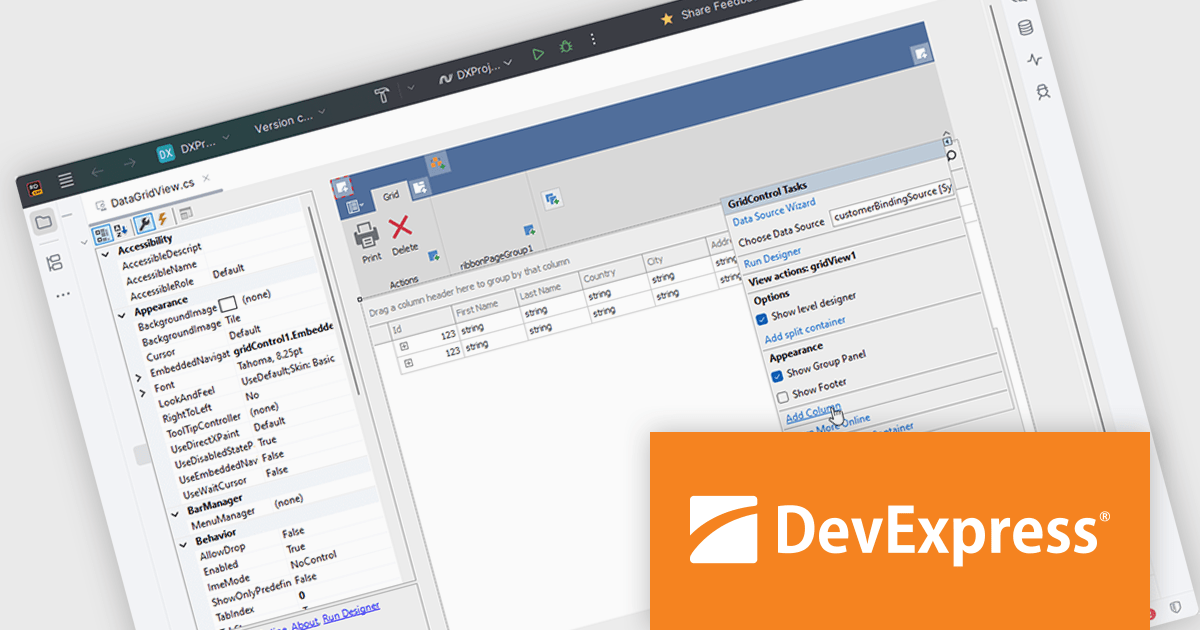
The DevExpress DXperience 25.2 release introduces JetBrains Rider support, allowing developers to visually configure and customize major DevExpress UI WinForms components directly within Rider’s designer environment. This integration brings familiar design-time experiences to teams using Rider, making it easier to adjust layouts, component properties, and UI behavior without leaving the IDE. By aligning DevExpress visual designers with Rider, the update supports faster iteration, clearer UI intent, and a more consistent development experience across tools.
DevExpress DXperience is licensed per developer and is available as a Perpetual License with a 12 month support and maintenance subscription. See our DevExpress DXperience licensing page for full details.
For more information, visit our DevExpress DXperience product page.
DevExpress Universal is a comprehensive suite of UI components and developer tools that supports the creation of feature-rich applications across web, desktop, and mobile platforms, including .NET, JavaScript, Blazor, ASP.NET, WinForms, WPF, and MAUI. It focuses on delivering consistent user interfaces, advanced data visualization, reporting, dashboards, and productivity features that help teams design, build, and maintain complex applications using a unified set of technologies and patterns.
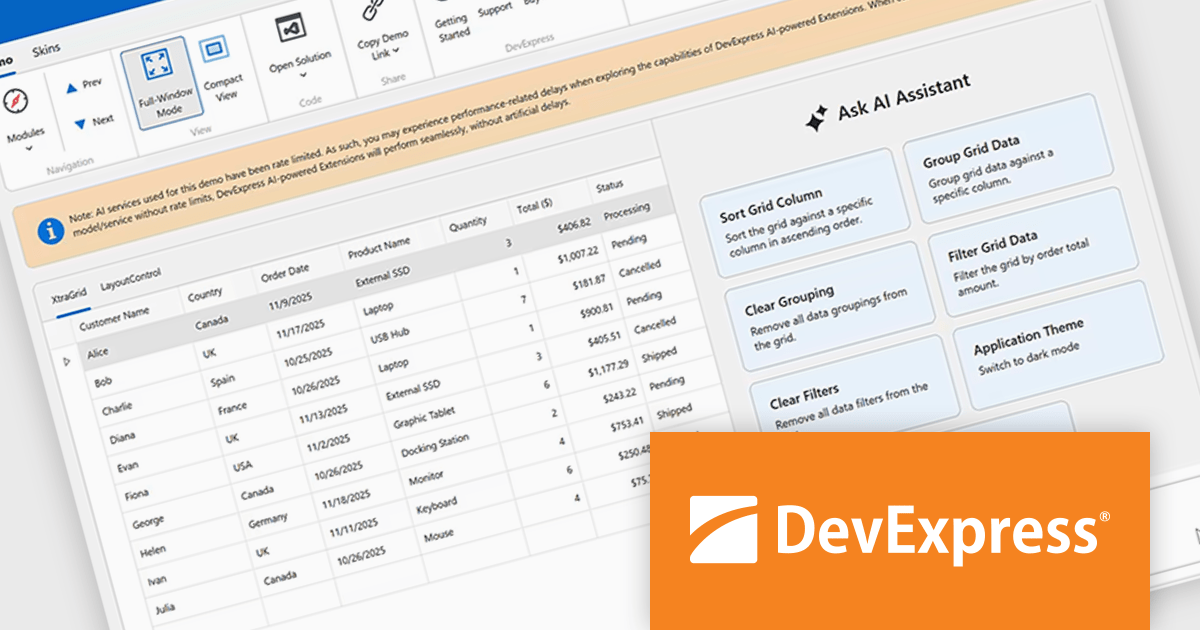
DevExpress Universal v25.2 introduces AI Tool Calling (Natural Language Control for UI Components), a cross-platform feature that extends Microsoft.Extensions.AI tool-calling to enable natural-language interaction with application UI and logic. Developers can expose UI components, ViewModels, and business services as AI-invokable tools, grouped into dynamic toolsets that adapt to the application’s current context. When users interact through the DevExpress AI Chat Control, the language model interprets their request, selects the appropriate tool, resolves the target instance, and executes the action in real time, making applications easier to use while giving developers full control over what the AI can see and do.
DevExpress Universal is licensed per developer and is available as a Perpetual License with a 12 month support and maintenance subscription. See our DevExpress Universal licensing page for full details.
For more information, visit our DevExpress Universal product page.
Spread.NET by MESCIUS is a tool for building Excel-like applications in your .NET projects. It lets you create interactive spreadsheets, grids, dashboards, and even forms within WinForms, ASP.NET, and WPF applications. With its rich feature set, including a robust calculation engine, formula support, and Excel compatibility, Spread.NET helps developers to build data analysis tools, budgeting apps, scientific dashboards, and more, all within the familiar .NET environment.
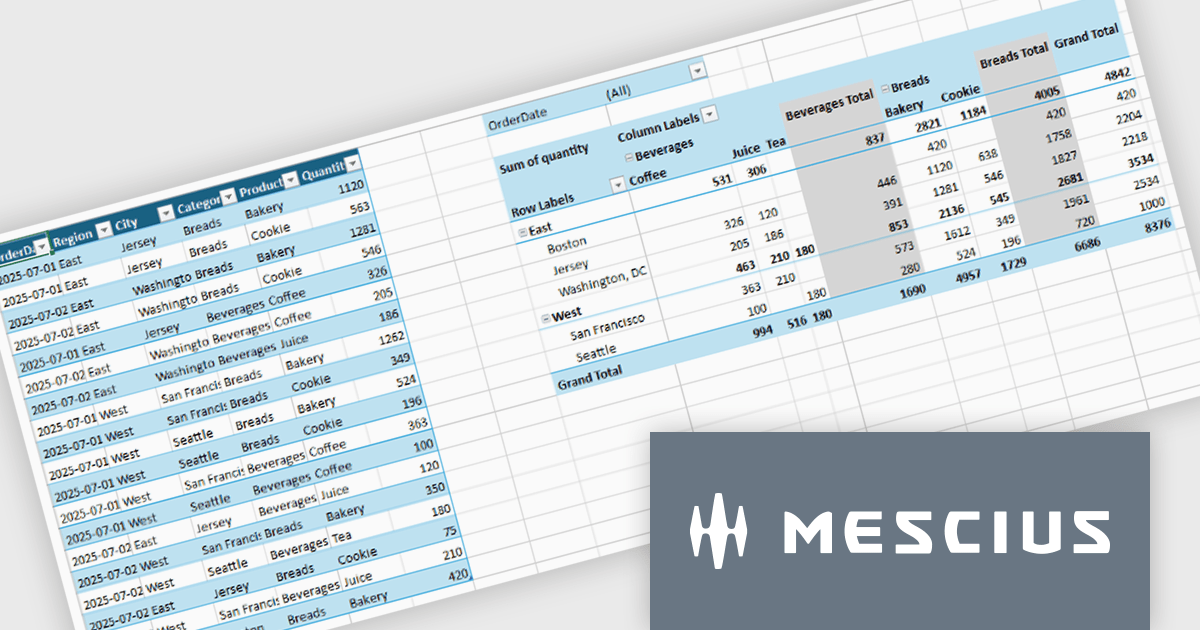
The Spread.NET v19 update introduces a new pivot table engine that enables software developers to summarize, analyze, and explore large datasets directly within WinForms applications. This built-in capability supports interactive grouping, filtering, and multidimensional analysis inside the spreadsheet, allowing users to work with complex data without exporting it to external reporting or business intelligence tools. By delivering Excel-like pivot table functionality with high performance and programmatic control, the pivot engine helps developers simplify application architecture, reduce dependencies, and provide a more integrated and responsive data analysis experience for end users.
To see a full list of what's new in v19, see our release notes.
Spread.NET is licensed per developer and is available as a Perpetual License with a 12 month support and maintenance subscription. We can supply any Spread.NET license including new licenses, maintenance renewals, and upgrade licenses. See our Spread.NET licensing page for full details.
For more information, visit our Spread.NET product page.
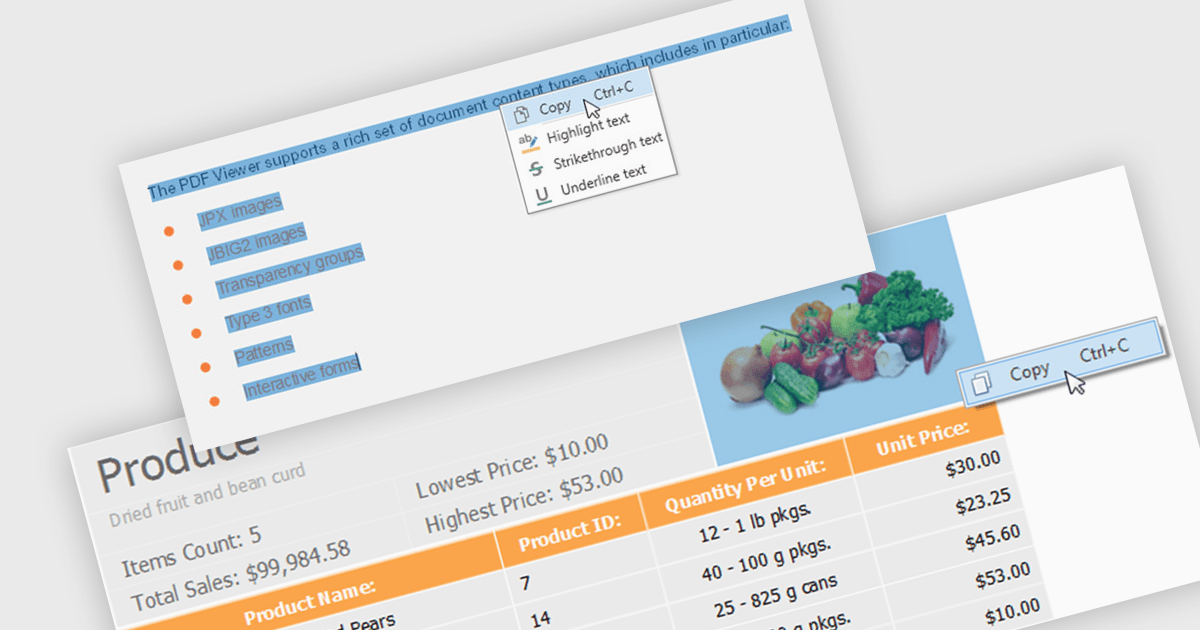
Extracting content using a PDF Viewer refers to enabling end users or applications to select and retrieve content directly through the viewer’s user interface, based on interactive actions such as text selection, area selection, or page-level capture. For software developers, this means the viewer acts not only as a rendering surface but also as a controlled extraction layer that exposes selected text, images, or regions. This approach is valuable in review, approval, and data capture scenarios because it reflects explicit user intent, aligns extracted data with what is visibly selected on screen, and avoids reliance on background parsing alone, resulting in more predictable and user-driven content retrieval within applications.
Several WinForms PDF Viewer components allow content extraction, including:
For an in-depth analysis of features and price, visit our comparison of WinForms PDF Viewer components.
DevExpress WinForms is a comprehensive suite of 190+ UI controls and development tools designed for building high-performance desktop applications. It offers a broad array of customizable controls, from data grids and ribbon interfaces to advanced charts, maps, and diagramming components. This empowers developers to rapidly create functionally rich applications, while adhering to accessibility guidelines and touch-enabled technology for modern Windows environments.
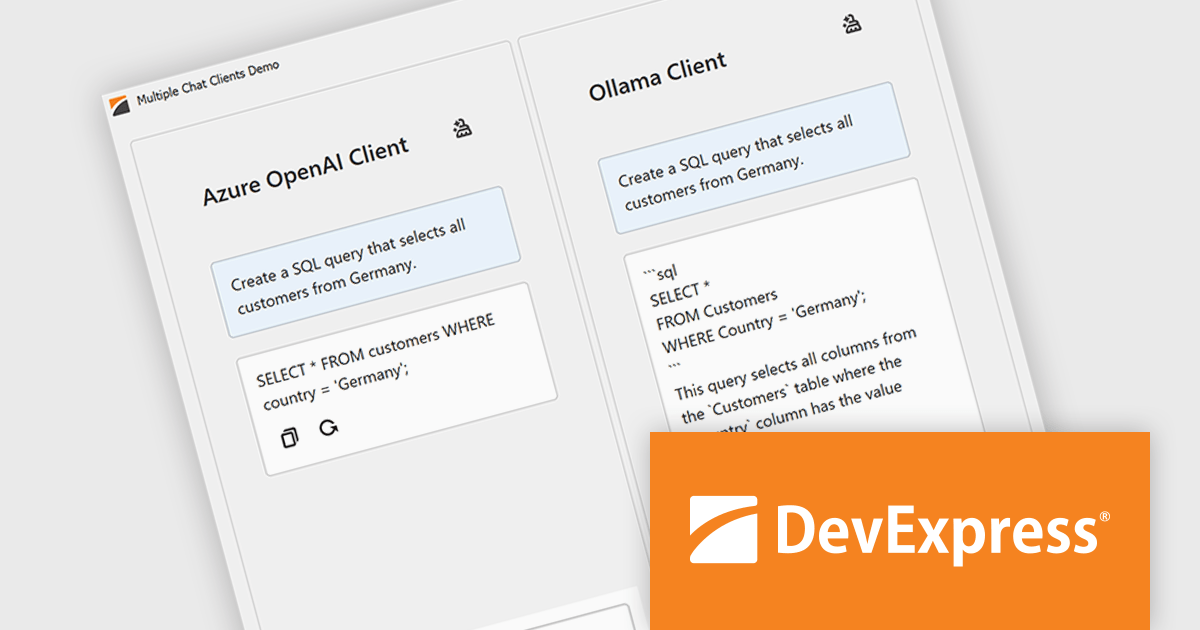
The DevExpress WinForms 25.2 update introduces multi-provider support in the AI Chat Control, allowing developers to integrate several AI services into one application. This enables advanced use cases such as side-by-side comparison of responses from different AI models, concurrent sessions with independent chat histories, and dynamic switching between providers during runtime. It’s especially useful in environments where evaluating model performance or offering user choice is essential, such as customer support tools, research platforms, or development sandboxes.
To see a full list of what's new in version 25.2, see our release notes.
DevExpress WinForms is licensed per developer and is available as a Perpetual License with a 12 month support and maintenance subscription. See our DevExpress WinForms licensing page for full details.
DevExpress WinForms is available individually or in the following products:
電話: (888) 850 9911
Fax: +1 770 250 6199


