


公式サプライヤー
公式および認定ディストリビューターとして200社以上の開発元から正規ライセンスを直接ご提供いたします。
当社のすべてのブランドをご覧ください。
Stimulsoft Ultimate is a reporting and dashboard solution that provides a set of tools for building interactive reports and data visualizations across platforms, including WinForms, ASP.NET, .NET Core, Blazor, JavaScript, WPF, PHP, Java, and Avalonia. It enables developers and organizations to design, generate, and deploy professional reports and dashboards using visual designers, flexible styling options, rich charting and data visualization components, and extensive data connectivity. With support for multiple development environments and technologies, Stimulsoft Ultimate helps teams improve report creation, maintain consistent designs, and deliver clear, data-driven insights for business intelligence, analytics, operational reporting, and enterprise applications.
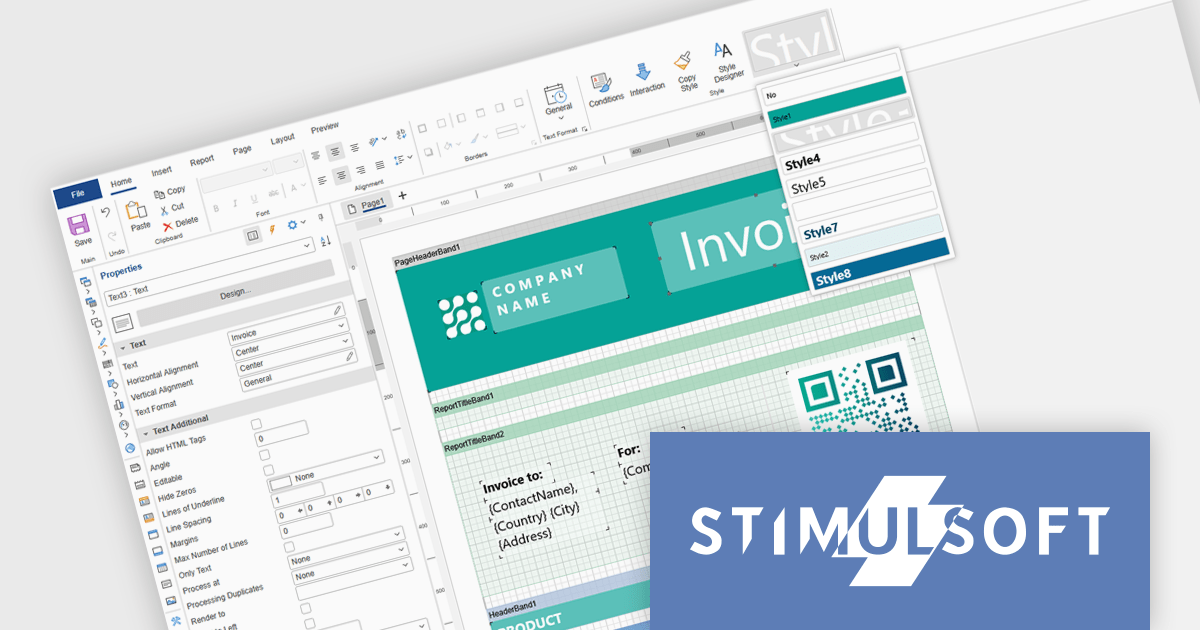
Stimulsoft Ultimate enables developers to apply centralized report styling that ensures consistent formatting across report elements while reducing the time required to design and maintain reports. By using reusable styles for fonts, colors, borders, and other visual properties, developers can standardize report layouts, quickly apply formatting to multiple components, and implement global design changes without editing each element individually. This approach improves development efficiency, simplifies maintenance, and helps teams deliver professional, visually consistent reports across applications and platforms.
Stimulsoft Ultimate is licensed per developer with Single, Team, Enterprise, and WorldWide options that support one to unlimited developers within an organization. Licenses include a 12 month subscription with updates, priority technical support, a royalty free runtime report designer and viewer, and a build server license for Team and higher tiers. See our Stimulsoft Ultimate licensing page for full details.
For more information, visit our Stimulsoft Ultimate product page.

DevExpress and ComponentSource have worked together for 25 years, building a long-standing partnership focused on providing professional developer tools. DevExpress is known for its extensive range of UI controls, reporting tools, dashboards, and application frameworks across platforms including .NET, JavaScript, Blazor, WinForms, WPF, and ASP.NET. Together, the two companies support development teams creating desktop, web, and mobile applications.
At the center of this collaboration is DevExpress Universal, a flagship product available through ComponentSource, giving developers access to the full suite of DevExpress UI controls, reporting, and testing tools in a single subscription. This comprehensive offering helps teams standardize on one vendor while covering multiple platforms and project requirements.
This long-term partnership strengthens ComponentSource’s product portfolio by including one of the most widely used developer toolsets in the industry. It also enables ComponentSource to deliver DevExpress products to customers worldwide, supported by international sales teams, local currencies, and licensing expertise that simplify the purchasing process for organizations across different regions.
Learn more about DevExpress.
ActiveReports.NET by MESCIUS is a reporting solution for the Microsoft .NET platform that enables developers to create and deliver data-driven reports in web, desktop, and cloud applications. It supports multiple report types, including section, page, and RDL (Report Definition Language) reports, and provides visual designers, a robust rendering engine, and export options such as PDF and Excel. Designed to integrate with modern .NET and ASP.NET Core applications, it helps teams build interactive, enterprise-grade reporting features into their software.
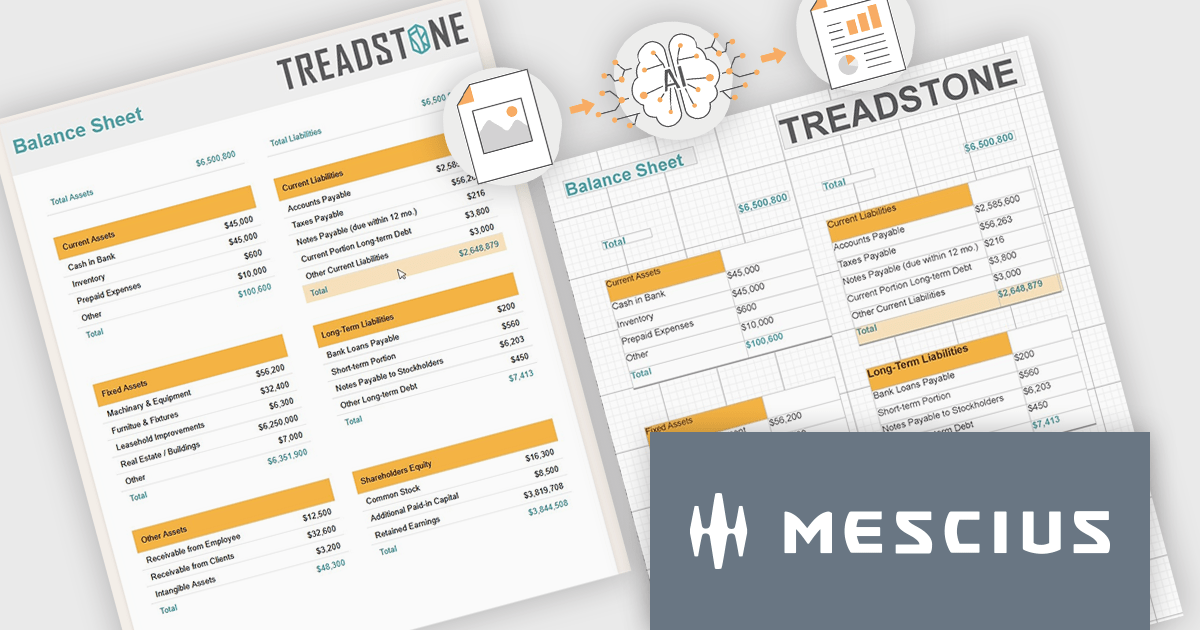
The ActiveReports.NET v20 update introduces a new AI powered image to report capability that enables developers to convert static report images such as screenshots, mockups, PDFs, or even photos of printed pages into fully editable report layouts in minutes. By leveraging Azure Document Intelligence to analyze page structure, text, and visual elements, it significantly reduces the manual effort required to recreate existing reports, accelerates the modernization of legacy assets, and streamlines migrations from other reporting platforms. This capability provides a practical starting point for rebuilding or refining reports while preserving full control over layout structure, styling, grouping, and data bindings to ensure alignment with application architecture and development standards.
To see a full list of what's new in v20, see our release notes.
ActiveReports.NET is licensed per developer. Dependent on geographic location it is available as either an Annual (Timed) Subscription License or as a Perpetual Developer License which comes with 1 year of software updates and support. Each developer requires a license to design, develop, or maintain applications. The Annual Subscription License must be renewed each year to continue to work with the software. Published applications are royalty free and do not expire. Optional pipeline licenses available for CI/CD build servers. See our ActiveReports.NET licensing page for full details.
Learn more on our ActiveReports.NET product page.
TeeChart for .NET is a comprehensive charting solution that enables developers to create informative, visually compelling charts for financial, scientific, statistical, and business applications. It manages complex data and delivers interactive visualizations. With optional source code and enterprise editions that include mobile and JavaScript components, TeeChart for .NET provides flexibility, customization, and consistent charting across desktop, web, and mobile platforms.
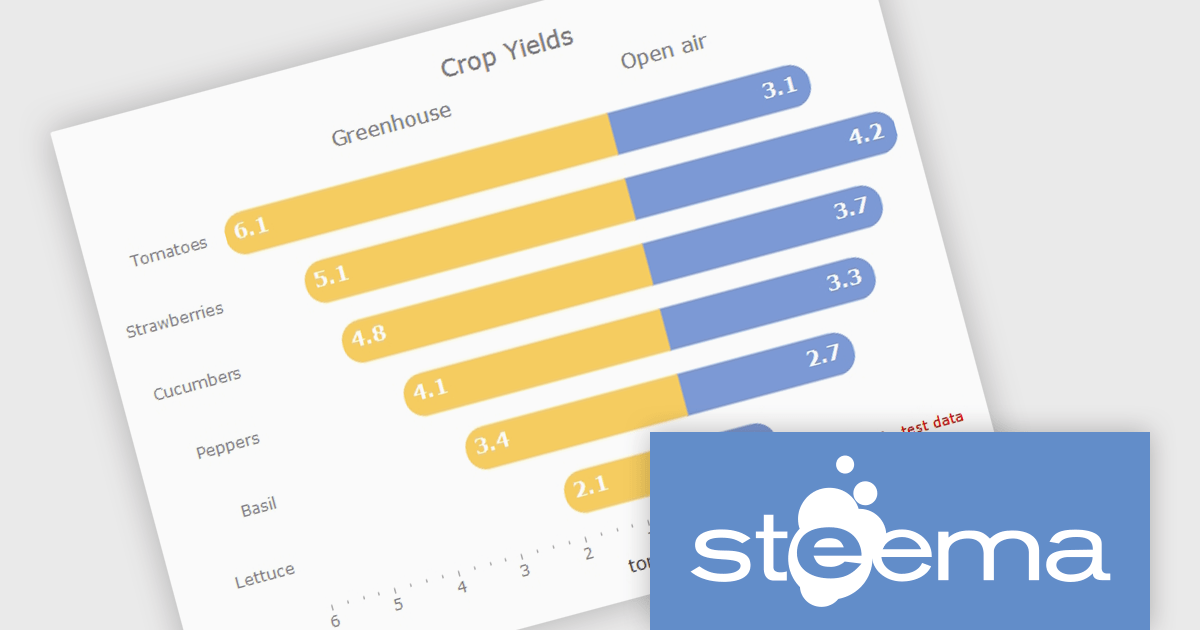
The TeeChart for .NET 2006 update introduces a Tornado Chart series type that enables developers to present structured side-by-side comparisons and perform sensitivity analysis. This chart type is particularly effective for highlighting the relative impact of multiple variables, making it well suited for financial modeling, risk assessment, and analytical dashboards. By offering built-in support within the existing TeeChart framework, it reduces the need for custom visualization logic, accelerates development time, and ensures consistent integration across reporting, analytics, and business applications.
To see a full list of what's new in version 2026, see our release notes.
TeeChart for .NET is licensed per developer and is available as a perpetual license. Each license includes one year of updates and upgrades. See our TeeChart for .NET Pro Edition licensing page for full details.
This update for TeeChart for .NET is available is available in the following products:
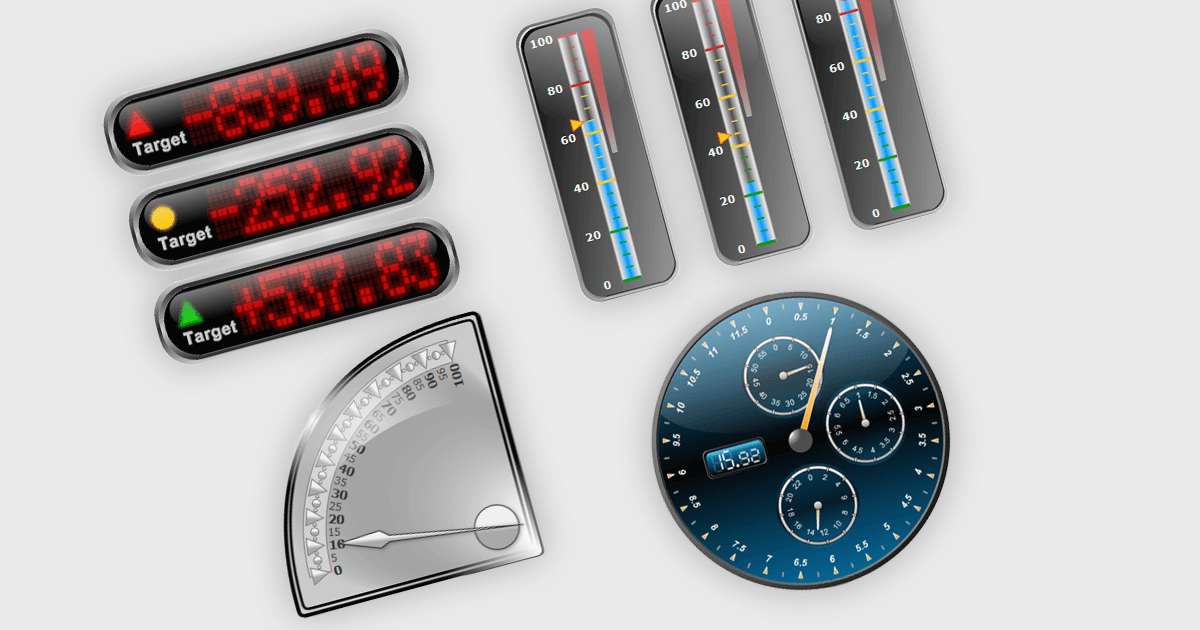
Gauge controls in .NET WPF UI suites are specialized visual components designed to present quantitative data in an intuitive, instrument-style format, similar to speedometers, thermometers, or dial indicators. They are commonly used in dashboards and monitoring applications to display key performance indicators, thresholds, and real-time metrics with clear visual cues such as ranges, tick marks, color-coded segments, and animated needles or pointers. Built to integrate with WPF’s data binding, templating, and styling capabilities, gauge controls allow developers to connect live data sources, customize appearance through themes and templates, and define ranges or alerts that highlight critical values. This makes them particularly useful in industrial systems, financial dashboards, health monitoring tools, and other applications where quick visual interpretation of numeric data is essential.
Many .NET WPF UI Suites contain gauges including:
For an in-depth analysis of features and price, visit our comparison of .NET WPF UI Suites.
電話: (888) 850 9911
Fax: +1 770 250 6199


