


公式サプライヤー
公式および認定ディストリビューターとして200社以上の開発元から正規ライセンスを直接ご提供いたします。
当社のすべてのブランドをご覧ください。
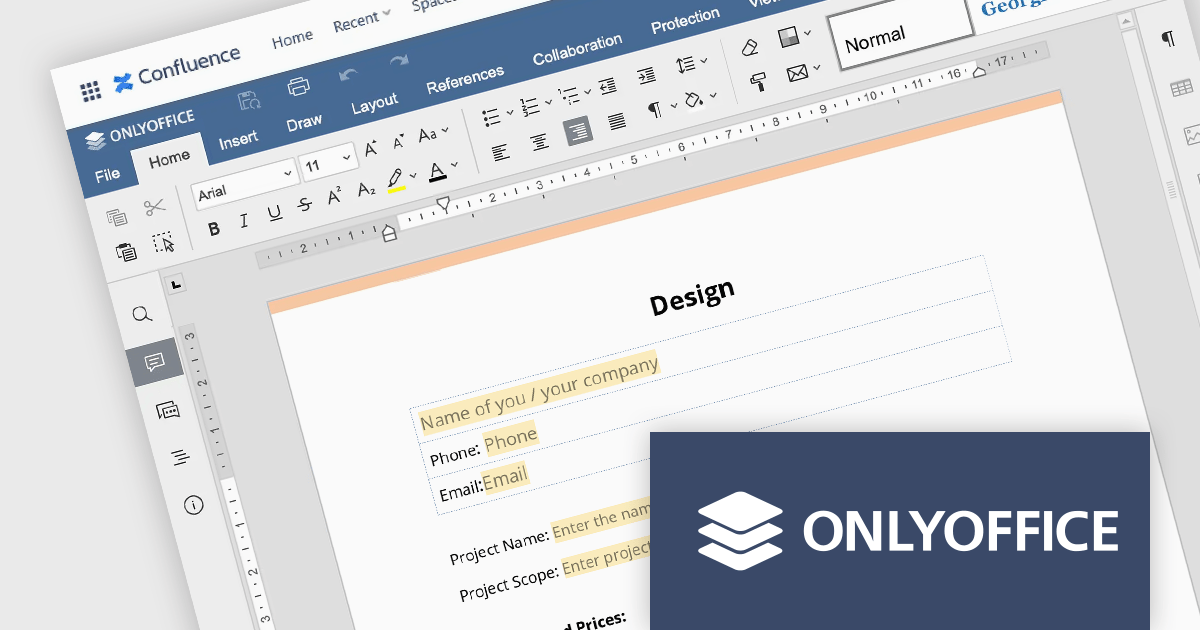
ONLYOFFICE Docs Enterprise Edition with Confluence Connector combines an online document editor with a seamless integration for Confluence, a centralized platform for project management and collaboration. This allows teams to create, view, edit, and collaborate on spreadsheets, presentations, and text files online, directly within Confluence, boosting efficiency and eliminating the need for file switching.
The ONLYOFFICE Confluence Connector v5.0.0 release (available as part of ONLYOFFICE Docs Enterprise Edition with Confluence Connector v8.0.1) adds functionality allowing you to create complex PDF forms with interactive fields and fill them out online, directly within your Confluence platform. This ability empowers teams to design and distribute easily fillable PDF forms seamlessly within Confluence, collecting valuable data from their users and fostering a more collaborative and productive work environment.
To see a full list of what's new in ONLYOFFICE Docs Enterprise Edition v8.0.1 with Confluence Connector 5.0.0, see our release notes.
ONLYOFFICE Docs Enterprise Edition with Confluence Connector is licensed per server and is available as an annual license with 1 year of support and updates, or as a perpetual license with 3 years of support and updates. See our ONLYOFFICE Confluence connector licensing page for full details.
For more information, see our ONLYOFFICE Confluence Connector product page.
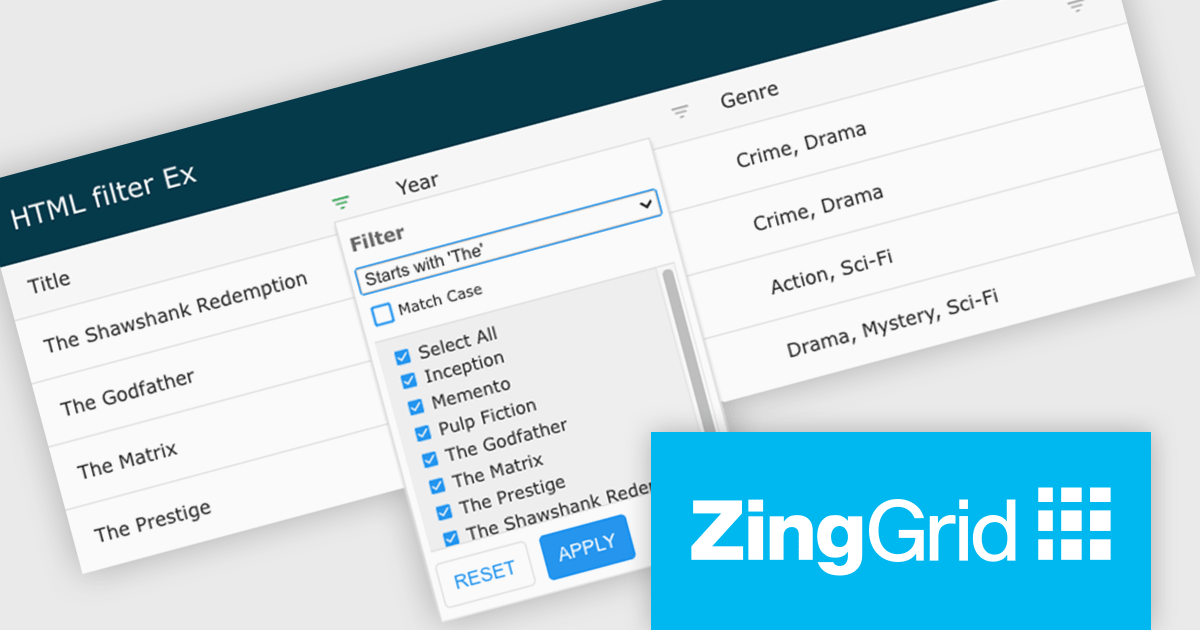
ZingGrid is a JavaScript library that simplifies the creation of interactive data tables and grids within web applications. Utilizing modern web components and focusing on performance and responsiveness, ZingGrid allows developers to implement features like searching, filtering, pagination, and in-line editing with minimal coding. This empowers efficient data visualization and manipulation for users, making it a valuable tool for web development.
Version 1.7.0 adds a rich set of filter conditions, including "contains," "notContains," "equal," "beginsWith," "endsWith," and many more, to pinpoint exactly the information you need. It also empowers you to create custom conditions, ensuring your filtering capabilities perfectly match your data and use case.
To see a full list of what's new in version 1.7.0, see our release notes.
ZingGrid is available as either a Single-Domain Website or Multi-Domain SaaS license. See our ZingGrid licensing page for full details.
For more information, visit our ZingGrid product page.
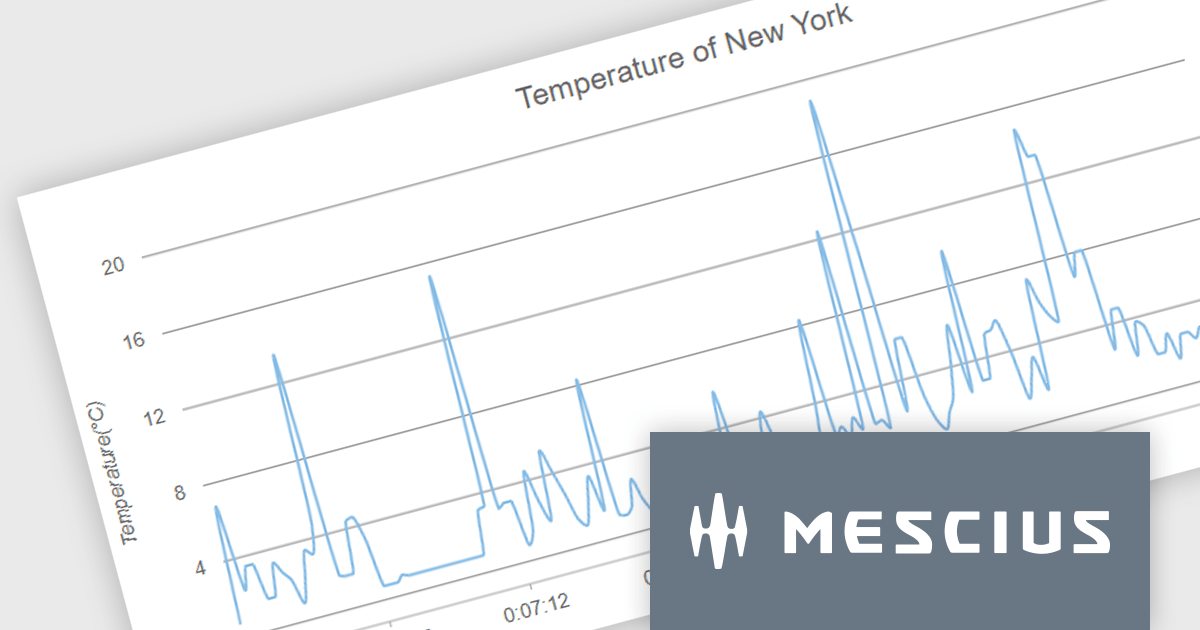
Wijmo by MESCIUS is a comprehensive suite of JavaScript UI controls for building interactive web applications. It offers a wide range of powerful components including grids, charts, inputs, and gauges, designed to streamline development processes and enhance user experiences. With its robust functionality and customizable features, Wijmo simplifies the creation of sophisticated web interfaces, empowering software developers to efficiently craft responsive and visually appealing applications without sacrificing performance or scalability.
The Wijmo 2024 v1 release includes significant rendering refinements for FlexChart and FlexPie. Notable improvements include smoother rounding for polylines and polygons in FlexChart, enhanced spline chart interpolation, and refined tooltips tailored specifically for small slices within FlexPie. These updates collectively enhance the visual quality, precision, and user experience of both chart components, providing developers with finer control over chart aesthetics and data representation.
To see a full list of what's new in 2024 v1, see our release notes.
Wijmo is licensed per developer. Developer Licenses are perpetual and include 1 year Subscription which provides upgrades, including bug fixes and new features. See our Wijmo licensing page for full details.
For more information, visit our Wijmo product page.
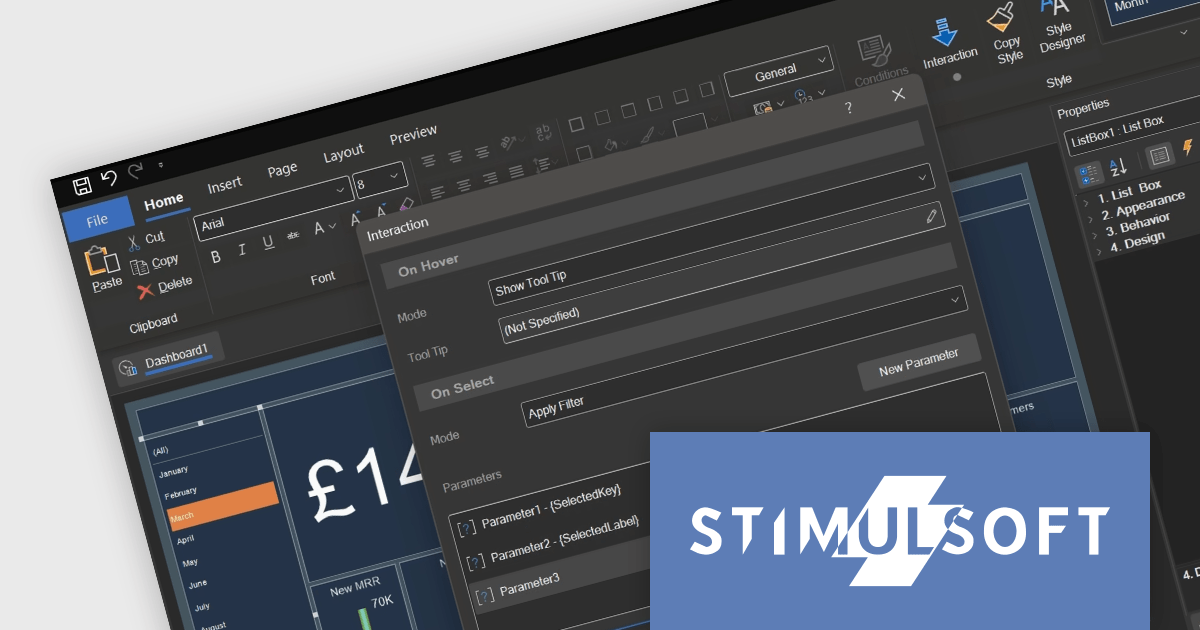
Stimulsoft Dashboards.JS is a JavaScript library designed for building interactive dashboards within web applications. It offers a comprehensive suite of tools for data processing, visualization, and dashboard design. Compatible with any HTML5 browser, it allows you to create a variety of dashboards for various purposes and integrates seamlessly with popular JavaScript frameworks like React and Vue.js.
The Stimulsoft Dashboards.JS 2024.2 update adds tooltip functionality for list box, combo box and shape elements. Hovering over an item can now reveal more information, providing additional details and context on demand. This intuitive feature empowers users to explore data and grasp its meaning at a glance, enhancing overall understanding.
For full details of what's new in version 2024.2, see our release notes.
Stimulsoft Dashboards.JS is licensed per developer and is available as a Perpetual license with 1 year support and maintenance. See our Stimulsoft Dashboards.JS licensing page for full details.
Stimulsoft Dashboards.JS is available to buy in the following products:
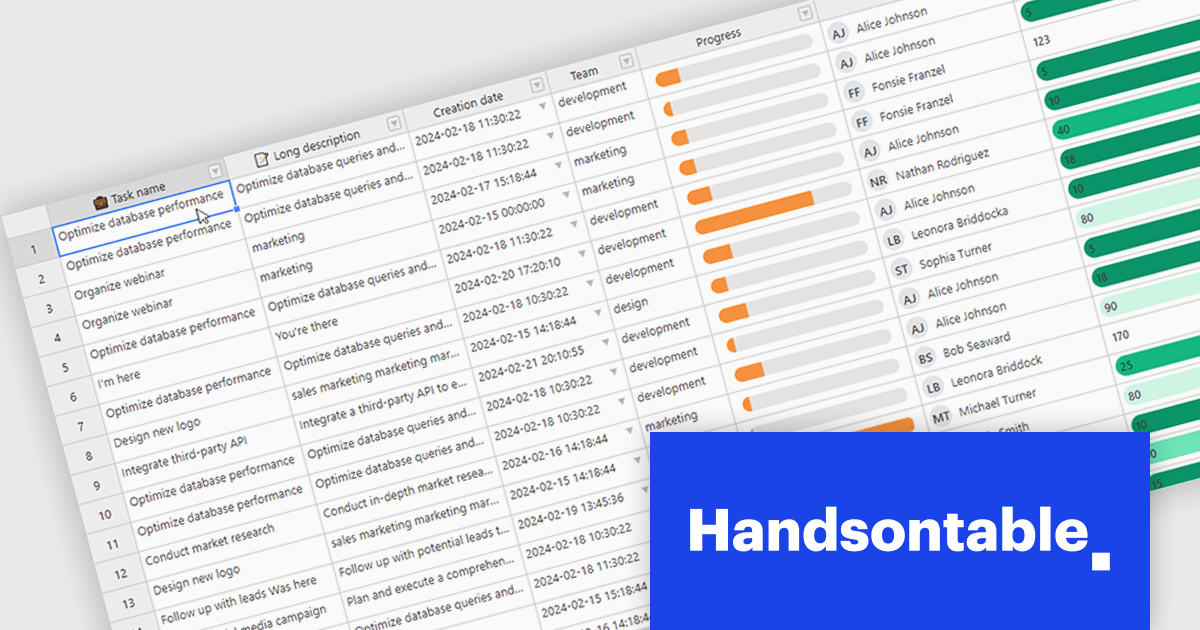
Handsontable is a JavaScript library designed to help developers build interactive data grids into their web applications. Offering a familiar spreadsheet-like interface, it allows users to edit, sort, and filter data with ease. Highly customizable and compatible with popular frameworks like React and Angular, Handsontable empowers developers to build robust data manipulation features into their web applications.
Handsontable 14.2.0 improves cell re-rendering using the React wrapper. The wrapper now uses memoization to optimize performance during user interactions like cell editing or scrolling in the grid, allowing the wrapper to remember the previous state and only update the elements that have actually changed. This smarter approach results in a smoother and more stable experience in your Handsontable apps, especially for complex custom cell types.
To see a full list of what's new in version 14.2.0, see our release notes.
Handsontable is licensed per developer and is available as an Annual or Perpetual license with 1 year support and maintenance. See our Handsontable licensing page for full details.
For more information, visit our Handsontable product page.
電話: (888) 850 9911
Fax: +1 770 250 6199


