


公式サプライヤー
公式および認定ディストリビューターとして200社以上の開発元から正規ライセンスを直接ご提供いたします。
当社のすべてのブランドをご覧ください。
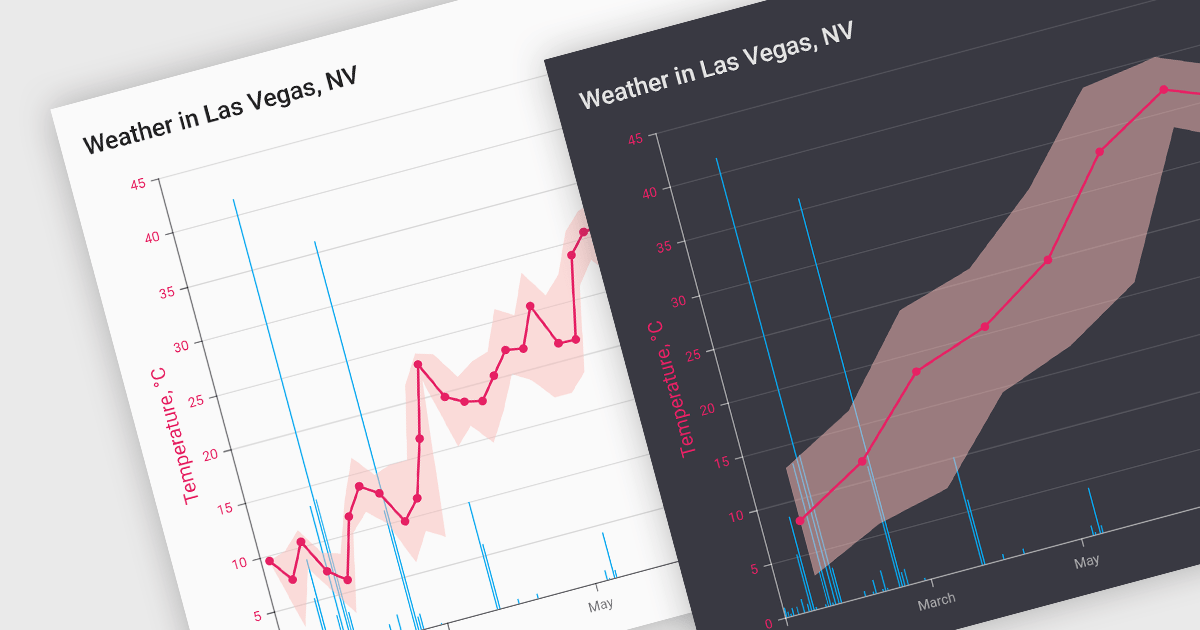
Data aggregation functionality in charts refers to the process of combining and summarizing raw data to provide a more concise and understandable representation. This technique involves collecting and grouping data points based on specific criteria, such as time intervals, categories, or geographic regions, and then calculating summary statistics, such as averages, totals, or percentages. The aggregated data is then used to create charts and graphs that offer a comprehensive overview of trends, patterns, or comparisons within the dataset. This approach helps in simplifying complex datasets and makes them more accessible for analysis, allowing decision-makers to derive meaningful insights and draw informed conclusions from the visual representation of aggregated information.
Several React chart controls support data aggregation including:
For an in-depth analysis of features and price, visit our React Chart Controls comparison.
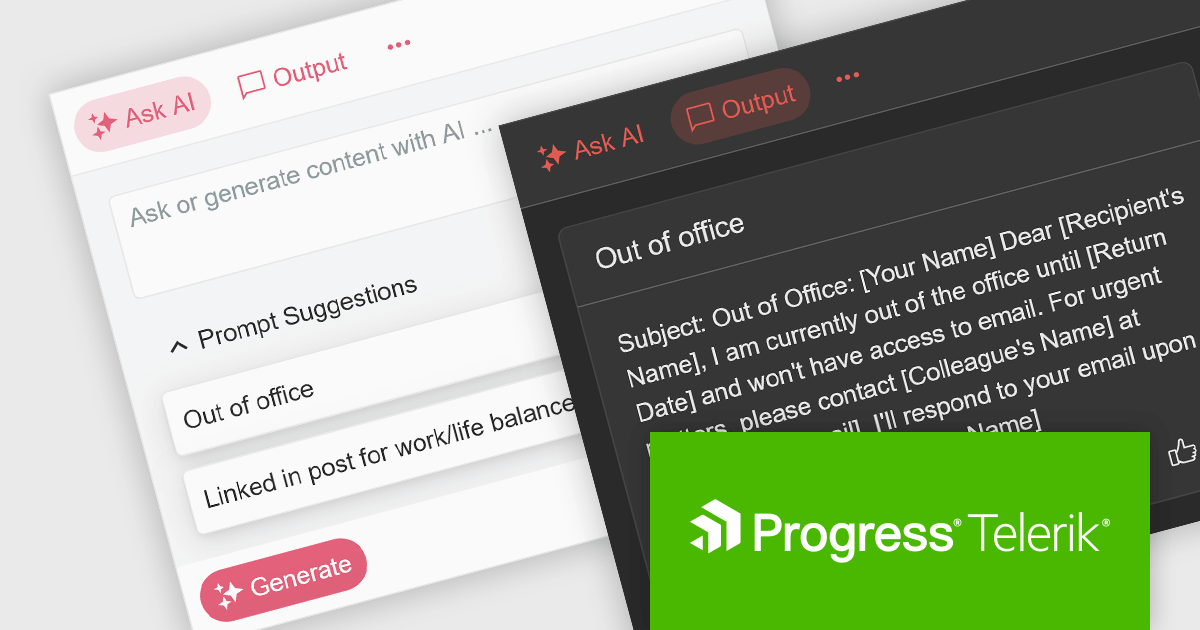
KendoReact by Telerik is a professional UI kit of more than 120 responsive and customizable native UI and DataViz components for React developers. Designed to save time building powerful high performance React apps, it helps ensure a modern, consistent look-and-feel across your app's UI.
KendoReact v7.1.0, which is part of the 2024 Q1 release, introduces an "AIPrompt" component which allows React developers to integrate generative AI services into their applications. With it you can set up custom suggestions to actively guide users, customize the generate button and prompt input field, and define custom prompt commands so it will do a certain action when a specific command is given. This component also enables you to adapt its behaviour based on user interaction, to ensure it responds smoothly, as it emits several user triggered events. This will help to give your application a modern, customizable and seamless UI.
To see a full list of what’s new in 2024 Q1 (v7.1.0), see our release notes.
KendoReact is licensed per developer and is available as a perpetual license with a 1 year support subscription, which is available in 3 tiers: Lite, Priority or Ultimate. See our KendoReact licensing page for full details.
KendoReact is available to buy in the following products:
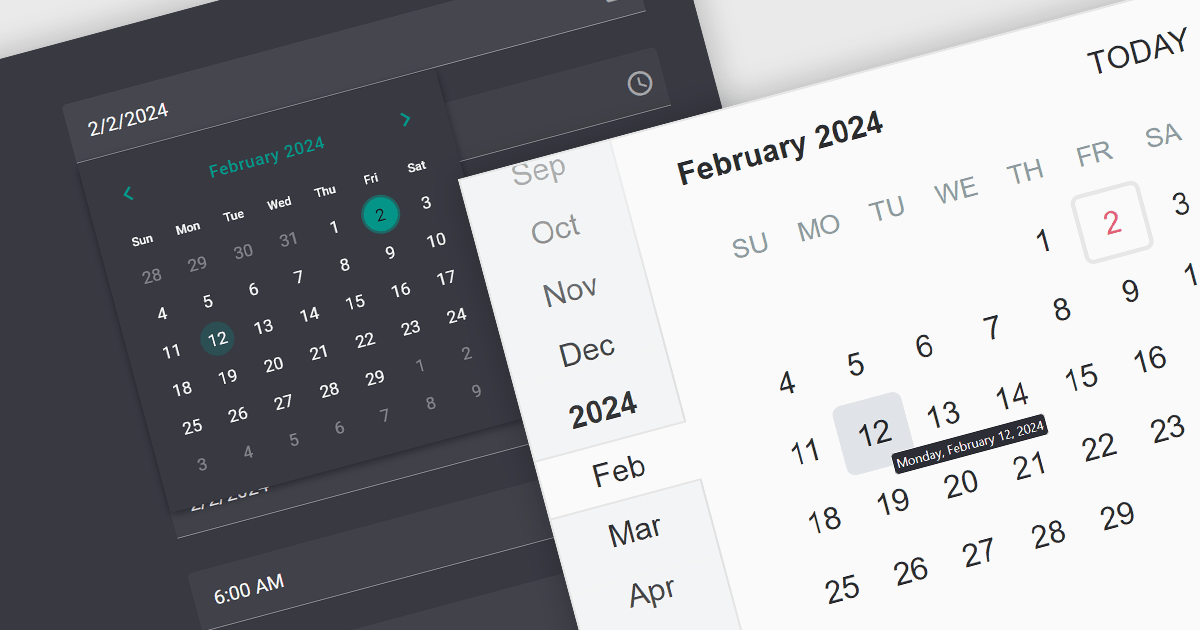
A date editor control is a user interface element designed for selecting and entering dates. It typically combines a text field for manual input with a calendar popup for visual selection. Beyond basic date picking, many controls offer features like time selection, range definition, drop-down lists for pre-defined dates, and even input masks for enforcing specific date formats. Commonly found in applications like forms, booking systems, and calendars, date editor controls streamline date input, improving user experience and data accuracy.
Several React data editor collections provide date editors including:
For an in-depth analysis of features and price, visit our React Data Editors comparison.
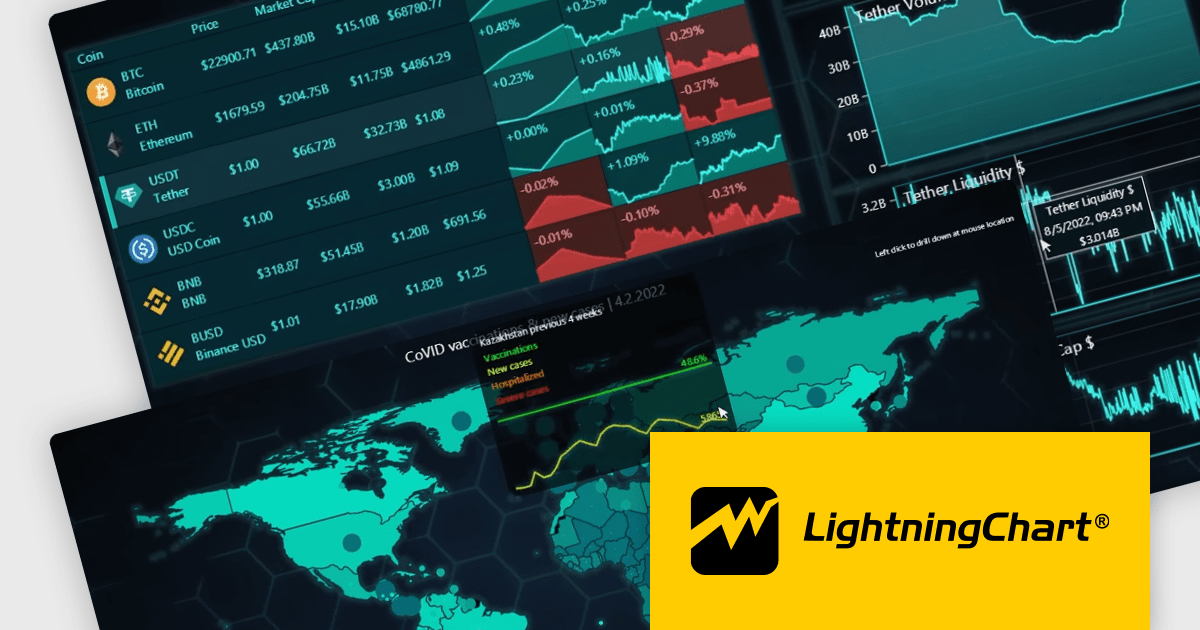
LightningChart JS Trader is a comprehensive charting solution specifically designed for building high-performance financial and trading applications in JavaScript. It equips developers with a rich set of financial charts, over 100 technical indicators for in-depth analysis, and 30+ drawing tools for visual annotations. Additionally, a fully featured datagrid with sparkline support allows for organized data management and display. This combination empowers developers to create interactive and visually engaging trading dashboards, charting tools, and other financial applications with high performance and extensive customization options.
LightningChart JS Trader features include:
LightningChart JS Trader is licensed per developer, per application, per year. The annual license includes technical support and product updates for one year. To continue using the software you will need to renew your license each year. There are three editions to choose from; Basic, Plus and Ultimate which offer different levels of functionality and distribution rights. See our LightningChart JS Trader Licensing page for full details.
For more information, visit our LightningChart JS Trader product page.
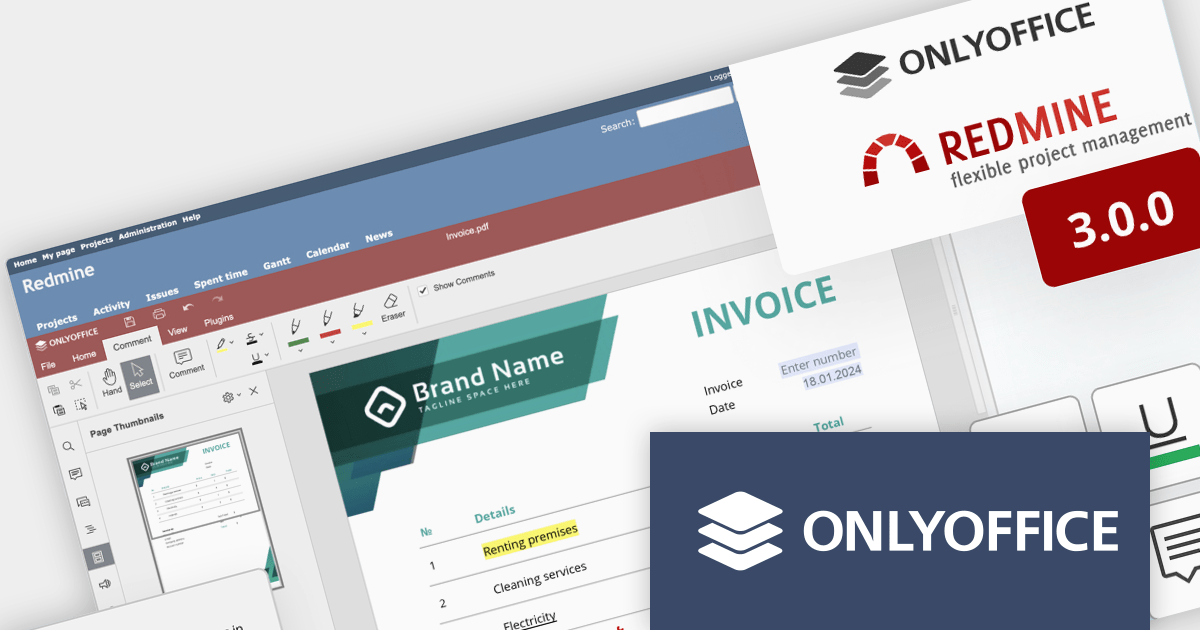
ONLYOFFICE Docs Enterprise Edition with Redmine Connector combines an online document editor with a seamless integration for Redmine, the Ruby on Rails-based project management hub. This allows teams to create, view, edit, and collaborate on spreadsheets, presentations, and text files online, directly within Redmine, boosting efficiency and eliminating the need for file switching.
ONLYOFFICE Redmine connector v3.0.0 expands the list of file formats that are available for editing. Previous releases supported DOCX, XLSX, PPTX, DOCXF and OFORM, but the latest update allows you to use ONLYOFFICE Docs directly within Redmine, to edit DOCM, DOTM, DOTX, XLSM, and XLTM files. The following formats may also be opened for editing by checking them in the format settings, though please note that data loss may occur due to format restrictions: EPUB, FB2, HTML, ODT, OTT, RTF, TXT, CSV, OTS, ODS, and ODP.
To see a full list of what's new in v7.5.1 (3.0.0), see our release notes.
ONLYOFFICE Docs Enterprise Edition with Redmine Connector is licensed per server and is available as an annual license with 1 year of support and updates, or as a perpetual license with 3 years of support and updates. See our ONLYOFFICE Redmine connector licensing page for full details.
For more information, see our ONLYOFFICE Redmine connector product page.
電話: (888) 850 9911
Fax: +1 770 250 6199


