


公式サプライヤー
公式および認定ディストリビューターとして200社以上の開発元から正規ライセンスを直接ご提供いたします。
当社のすべてのブランドをご覧ください。
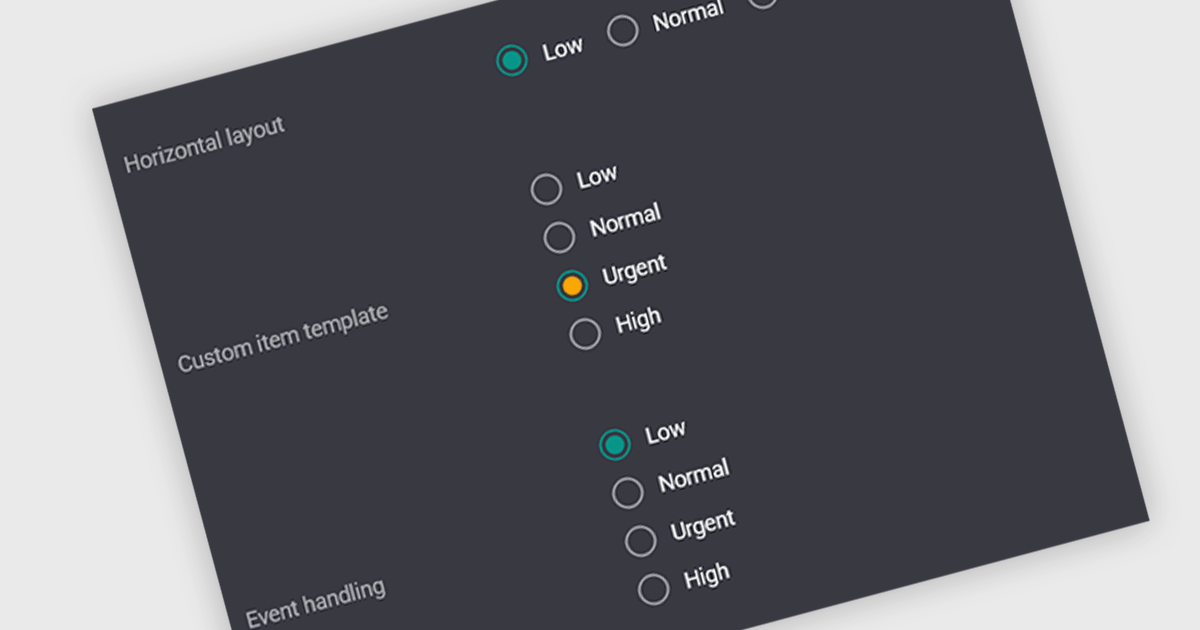
A radio group is a user interface element that presents a set of predefined options where only one value can be selected at a time for a particular field. It allows users to choose a single state, category, or configuration directly within the editing interface, with the selected option mapped to the underlying data value. This approach improves data consistency by preventing invalid combinations, simplifies validation logic by constraining input to known values, and accelerates data entry by replacing manual text input with clear, clickable choices that reduce ambiguity and input errors.
Several Vue.js data editor collections include radio group functionality, including:
For an in-depth analysis of features and price, visit our comparison of Vue.js data editor collections.
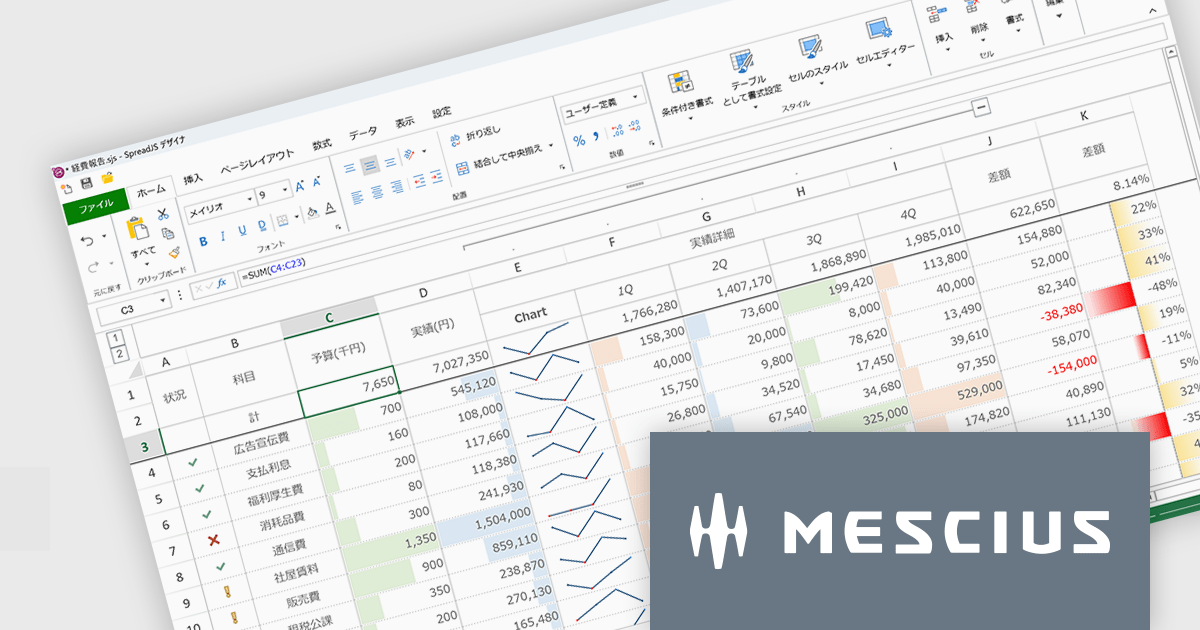
SpreadJSはWebアプリケーションでMicrosoft ExcelライクなUIと機能性を実現するために開発されたJavaScriptライブラリです。多数のExcel互換機能を備えるほか、TypeScriptでの開発や、Angular、React、Vue.jsをはじめとする主要JavaScriptフレームワークにも対応しています。付属するGUIデザイナもExcelに類似しているため、各種外観スタイルを直感的に操作できます。多くのコード量が必要な設定もノンコーディングで実現し、開発工数を大幅に削減します。
SpreadJS V19Jでは、各種AIプラットフォームのAPIと連携する機能が追加され、表計算環境におけるデータ活用が大きく進化しております。これにより、従来のように複雑な関数を扱うことなく、自然言語による指示でデータ分析や加工を実行できるようになっております。新たに追加されたAI関数として、AIへクエリを送信して分析を行う機能や、多言語翻訳、テキストの感情分析を行う機能が提供されております。これにより、従来は手作業で行っていた分析業務の効率化が可能となっております。また、数式エディタにもAI機能が組み込まれており、自然言語から数式を自動生成できるほか、作成した数式の内容を解析して説明を取得することが可能です。複雑なロジックの理解や保守性向上にも寄与いたします。
これらの機能により、SpreadJSは従来の表計算ツールから、AIと連携した高度なデータ分析基盤へと進化しており、さまざまな業務シーンでの活用が期待されます。
V19Jでの新機能一覧は、リリースノートを参考ください。
SpreadJSのライセンスは、開発ライセンスや配布ライセンス、テスト配布ライセンスなどの種類があります。なお、各ライセンスに付属されているサブスクリプション(1年間)にはテクニカルサポートや無償アップグレード等のサービスが提供されます。詳細は、SpreadJS(日本語版)のライセンス をご参考ください。
製品詳細及び販売情報は、SpreadJS(日本語版)のページをご参考ください。
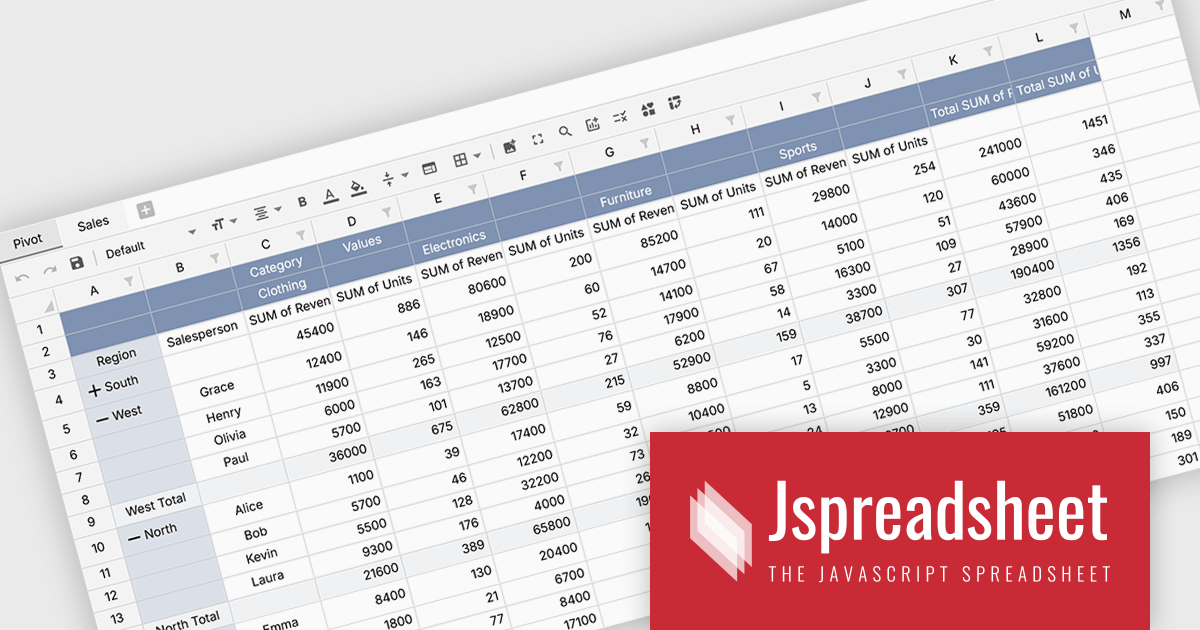
Jspreadsheet Pro is a flexible JavaScript-based spreadsheet solution that enables developers to create customizable, feature-rich data grids for web applications. It offers advanced formulas, data validation, and API integrations. Ideal for tasks like financial modeling, inventory management, and project tracking, it helps businesses efficiently manage and analyze data.
Jspreadsheet Pro introduces pivot table functionality that allows developers to summarize and analyze large datasets directly within browser based spreadsheet applications. It enables users to group data across multiple rows and columns, apply aggregation methods such as sum or average, and refine results through filtering and sorting. With built in spreadsheet formulas and cross worksheet references, developers can provide interactive data analysis capabilities without requiring external tools or additional backend processing.
Jspreadsheet Pro is licensed as an Annual or a Perpetual License with support and maintenance. We can supply any Jspreadsheet Pro license including new licenses, maintenance renewals, and upgrade licenses. See our Jspreadsheet Pro for full details.
For more information, visit our Jspreadsheet Pro product page.

Handsontable is a JavaScript library designed to help developers build interactive data grids into their web applications. Offering a familiar spreadsheet-like interface, it allows users to edit, sort, and filter data with ease. Highly customizable and compatible with popular frameworks like React and Angular, Handsontable empowers developers to build robust data manipulation features into their web applications.
The Handsontable 17.0.0 update adds a new MultiSelect cell type that allows a single cell to hold multiple values, making it well suited for data such as tags, user roles, product categories, or shipment contents. Instead of restricting entries to one option, users can choose any number of items from a dropdown interface that includes search and filtering capabilities for quickly locating options. Full keyboard navigation ensures efficient interaction for power users.
To see a full list of what's new in version 17.0.0, see our release notes.
Handsontable is licensed per developer and is available as an Annual or Perpetual license with 1 year support and maintenance. See our Handsontable licensing page for full details.
For more information, visit our Handsontable product page.
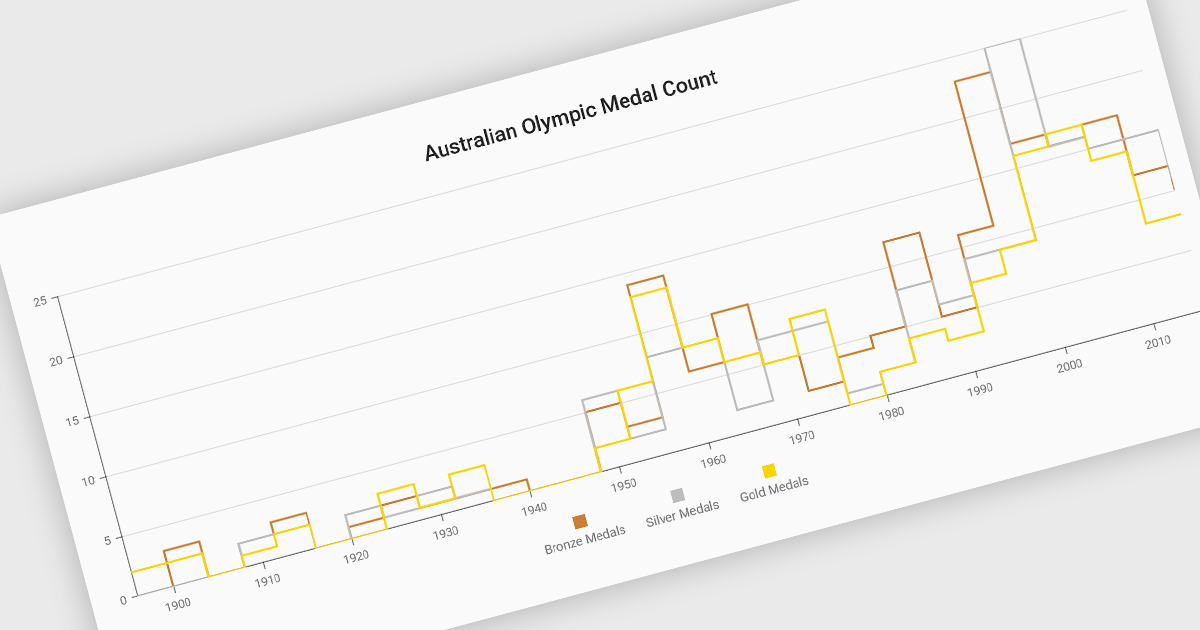
Step line charts are a variation of line charts that display changes between data points as a series of horizontal and vertical segments rather than diagonal lines. This structure highlights discrete transitions between values, making it easier to show when a change occurs and how long a value remains constant before the next update. Step line charts are useful for representing processes where values shift at specific moments, such as pricing tiers, system states, or configuration thresholds. By clearly separating periods of stability from points of change, the chart type helps developers and analysts interpret state-based or event-driven data with greater precision.
Several Vue.js chart components support the step line chart type, including:
For an in-depth analysis of features and price, visit our comparison of Vue.js charting components.
電話: (888) 850 9911
Fax: +1 770 250 6199


