


公式サプライヤー
公式および認定ディストリビューターとして200社以上の開発元から正規ライセンスを直接ご提供いたします。
当社のすべてのブランドをご覧ください。
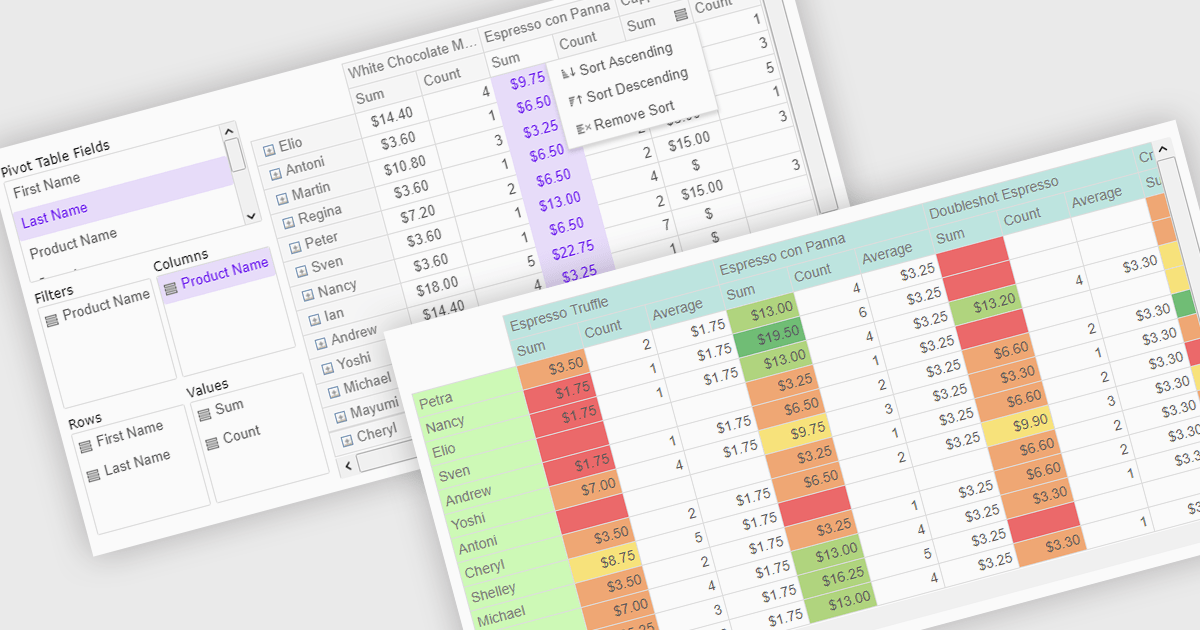
Pivot grids or tables are dynamic tools that allow users to organize and analyze large datasets interactively by allowing them to group, filter, and summarize data across multiple dimensions. This functionality makes it easier to spot patterns and insights, supporting faster decision-making and data processing. Common use cases include help to identify trends in product performance or customer demographics, or financial applications, where users can analyze and forecast expense patterns. Pivot grids empower users with an adaptable and user-friendly interface, offering both high-level overviews and detailed insights with minimal effort.
Several Vue.js UI suites offer pivot grid components including:
For an in-depth analysis of features and price, visit our comparison of Vue.js UI suites.

Charts in a dashboard component transform raw data into clear, actionable visuals, making it easy to monitor trends, track performance, and spot critical insights in real time. These interactive tools support various use cases, from sales forecasting and KPI tracking to project progress monitoring and customer behavior analysis. By offering a centralized, intuitive view of essential metrics, charts help teams make faster, data-driven decisions, optimize operational efficiency, and respond proactively to emerging opportunities or issues.
Several JavaScript products offer chart components with dashboard support including:
Explore our range of JavaScript dashboard components.
Need help to find the right software license, upgrade or renewal? Call, Email, or Live Chat with our experts.

ONLYOFFICE Docs is a comprehensive online editor, allowing users to create text documents, spreadsheets, presentations, and forms. It enables your users to edit, share, and collaborate on documents online in their preferred browser, within your own application. It is fully compatible with OOXML (Office Open XML) formats and supports popular Microsoft Office and other document formats such as CSV, DOC, DOCX, EPUB, HTML, ODP, ODS, ODT, PDF, PPT, PPTX, RTF, TXT, XLS, and XLSX.
The ONLYOFFICE Docs v8.2 update adds support for performing iterative calculations. This enables formulas to be repeatedly recalculated until a specific, stable result is reached or a set number of attempts is made. By setting iteration limits and defining acceptable precision levels, iterative calculations enable users to control the number of recalculations, allowing the formula to reach an approximation or convergence point that serves as the final value. This process is particularly useful when dealing with circular references, where a formula refers to its own cell either directly or through a sequence of references involving other cells. Without iterative calculations, such formulas would produce errors, as they would require an infinite loop of recalculations. This is widely used in scenarios requiring complex dependencies, such as financial projections, engineering simulations, and scientific modeling.
To see a full list of what's new in v8.2.0, see our release notes.
ONLYOFFICE Docs is licensed by the number of simultaneous document connections and is available as an annual license with 1 year support and upgrades. See our ONLYOFFICE Docs licensing page for full details.
For more information, see our ONLYOFFICE Docs product page.

ActiveReportsJS by MESCIUS is a JavaScript reporting toolkit that empowers developers to design and embed interactive reports within web applications. It offers a standalone report designer for crafting reports and a JavaScript report viewer component for seamless integration into web frameworks like React or vanilla JavaScript. This solution streamlines report creation, facilitates data visualization, and delivers a user-friendly report experience.
The ActiveReportsJS 5.1 update introduces a Master Report feature, which improves report design efficiency by allowing developers to create reusable templates that define common elements such as headers, footers, and styles. Multiple reports can inherit shared components, reducing redundancy and simplifying maintenance. Developers can ensure consistency across reports and make global updates more efficiently, making it easier to scale for larger applications. Using a master report template is valuable in dynamic web applications, where maintaining uniform reporting structures is crucial for delivering a cohesive user experience.
To see a full list of what's new in 5.1, see our release notes.
ActiveReportsJS is licensed on an annual subscription or perpetual basis and is available as a Single Deployment License for non-commercial use, and as a Single Domain License or Unlimited Domain License for commercial and/or SaaS use. See our ActiveReportsJS licensing page for full details.
Learn more on our ActiveReportsJS product page.

Stimulsoft Dashboards.JS is a JavaScript library designed for building interactive dashboards within web applications. It offers a comprehensive suite of tools for data processing, visualization, and dashboard design. Compatible with any HTML5 browser, it allows you to create a variety of dashboards for various purposes and integrates seamlessly with popular JavaScript frameworks like React and Vue.js.
The Stimulsoft Dashboards.JS 2024.4.1 release introduces new white and black dashboard style along with a new preset style for report components which offers a modern, sleek aesthetic with improved readability, making key data more distinguishable and reducing eye strain. This design ensures consistency across reports, enhances brand cohesion, and provides a professional, visually engaging experience. With easy application and customizable elements, users can quickly adapt their dashboards to suit their needs, while maintaining a uniform look. Optimized for both desktop and mobile, this new style streamlines the creation of visually appealing, user-friendly reports.
To see a full list of what's new in 2024.4.1, see our release notes.
Stimulsoft Dashboards.JS is licensed per developer and is available as a Perpetual license with 1 year support and maintenance. See our Stimulsoft Dashboards.JS licensing page for full details.
Stimulsoft Dashboards.JS is available in the following products:
電話: (888) 850 9911
Fax: +1 770 250 6199


