


公式サプライヤー
公式および認定ディストリビューターとして200社以上の開発元から正規ライセンスを直接ご提供いたします。
当社のすべてのブランドをご覧ください。

Vue diagrams are interactive visual representations, used to illustrate complex data structures, workflows, or system architectures. They leverage Vue's reactivity and component-based architecture to dynamically update as data changes, providing developers with an intuitive way to display and manage intricate relationships in real-time. Vue diagrams enhance the clarity of application logic, simplify debugging, and improve user experience by offering a clear, visual way to represent processes or data flows. This ultimately leads to more efficient development and better communication of complex concepts within the application.
Several Vue.js UI suites offer diagram controls including:
For an in-depth analysis of features and price, visit our Vue js UI suite comparison.
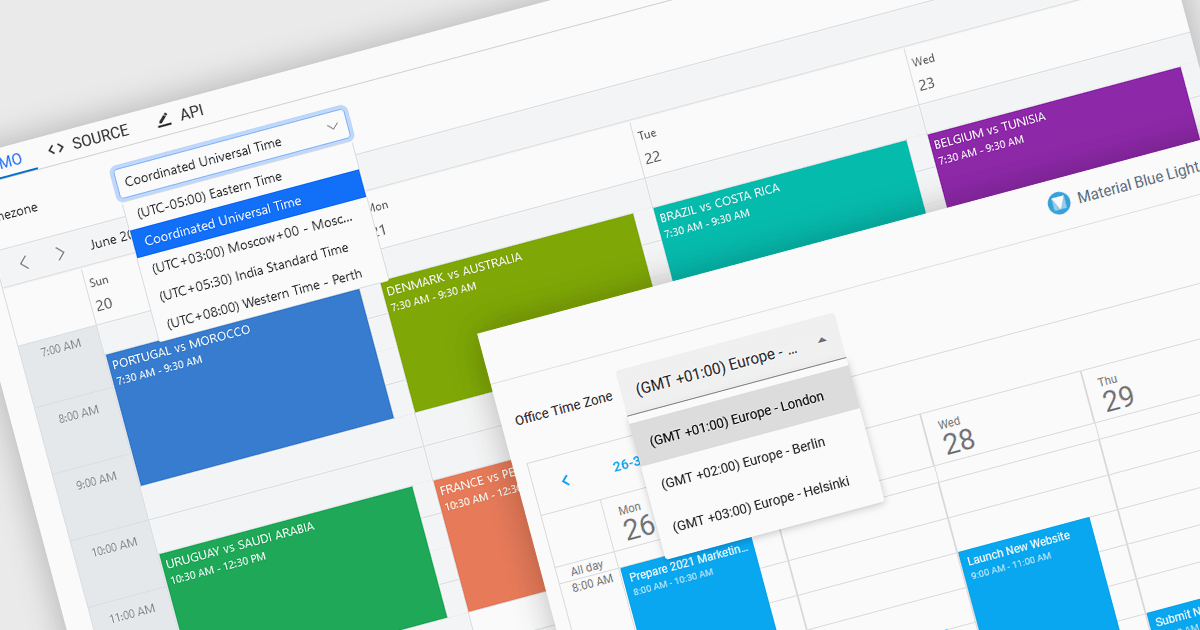
Time zone support in a scheduling component enables users to create, view, and manage events across different regions without manual time conversion. It automatically adjusts appointments based on the user’s local time zone and accounts for daylight saving time (DST) changes, ensuring accurate scheduling. This feature is particularly beneficial for global teams, remote workers, and businesses coordinating across multiple time zones. For example, an international company can schedule a meeting for participants in New York, London, and Tokyo, and each attendee will see the event in their local time. Time zone support eliminates confusion, reduces scheduling errors, and improves efficiency in cross-border collaboration.
Several JavaScript products offer scheduling components with time zone support including:
Explore our range of JavaScript scheduling components.
Need help to find the right software license, upgrade or renewal? Call, Email, or Live Chat with our experts.
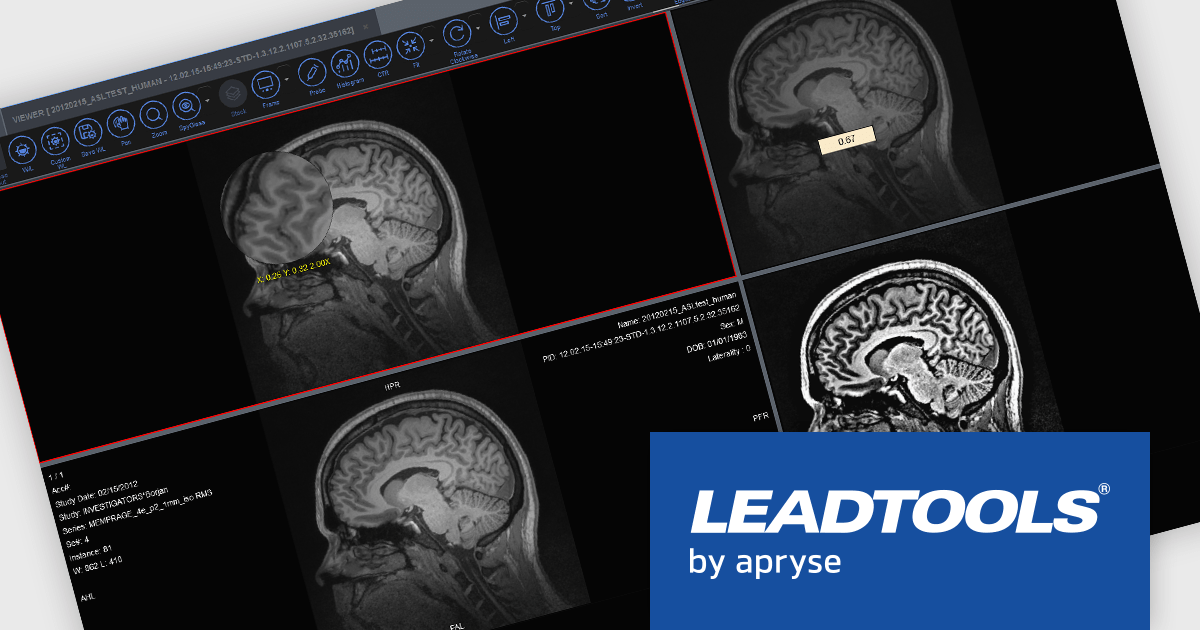
LEADTOOLS Medical SDKは、医療アプリケーションの開発を効率化するために設計されており、DICOMデータセット、8~16ビットの拡張グレースケール画像、および高度な画像注釈機能をサポートします。また、ウィンドウレベリングやLUT(ルックアップテーブル)処理などの画像表示用の専門的なツールや、医療向けの画像処理機能も含まれています。その他、可逆圧縮JPEGや符号付きおよび符号なし画像データの処理機能も備えています。Medical Imaging Suiteはこれらの機能をさらに拡張し、ウェブベースの医療画像アクセスを可能にするHTML/JavaScriptによるビューイング機能を追加しています。
LEADTOOLS Medical 3D Volume Renderingライブラリは、VRT、MIP、MPR、SSDなどの技術を用いて医療データを視覚化することを可能にします。これらのツールは、ウィンドウレベル、ズーム、密度調整のためのインタラクティブなコントロールを提供し、外観(境界線や解像度など)のカスタマイズ設定も可能です。また、3Dボリュームのキャッシュにより読み込み時間を短縮し、3D参照線や3Dカーソルを使用した同期スタックナビゲーションなどの高度な機能も備え、精密かつ効率的な医療画像処理をサポートします。
LEADTOOLS Medical SDKは、開発者がSDKを使用するための開発ライセンスと、エンドユーザー向けアプリケーション配布に必要な配布ライセンスがご用意されております。詳細情報については、 LEADTOOLS Medical(日本語)のライセンスページ をご参考ください。
詳細情報については、 LEADTOOLS Medical(日本語版)の製品ページと と LEADTOOLS Medical Suite(日本語)の製品ページをご参考ください。
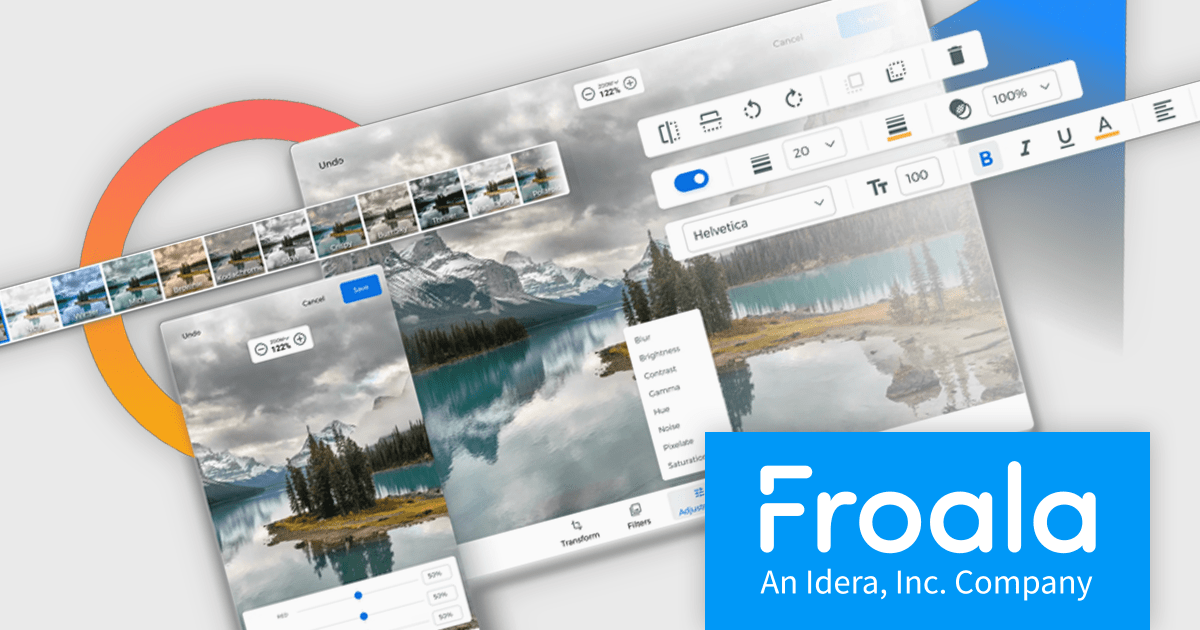
Froala Editor is a JavaScript-based WYSIWYG HTML editor that empowers developers to seamlessly integrate rich text editing functionalities into their applications.
The Froala Editor 4.3 release offers a new "Transform" button in the image editing popup, allowing users to enhance images directly within the editor. This feature allows users to apply filters, resize images, and make various other adjustments with ease. Once changes are made, the image is instantly replaced with the transformed version. This integration streamlines the editing process, offering users greater control and flexibility over their visual content without needing to leave the editor.
To see a full list of what's new in 4.3, see our release notes.
Froala Editor is licensed per product and domain. It is available as an annual or perpetual license with version upgrades and support. See our Froala Editor licensing page for full details.
For more information, visit our Froala Editor product page.
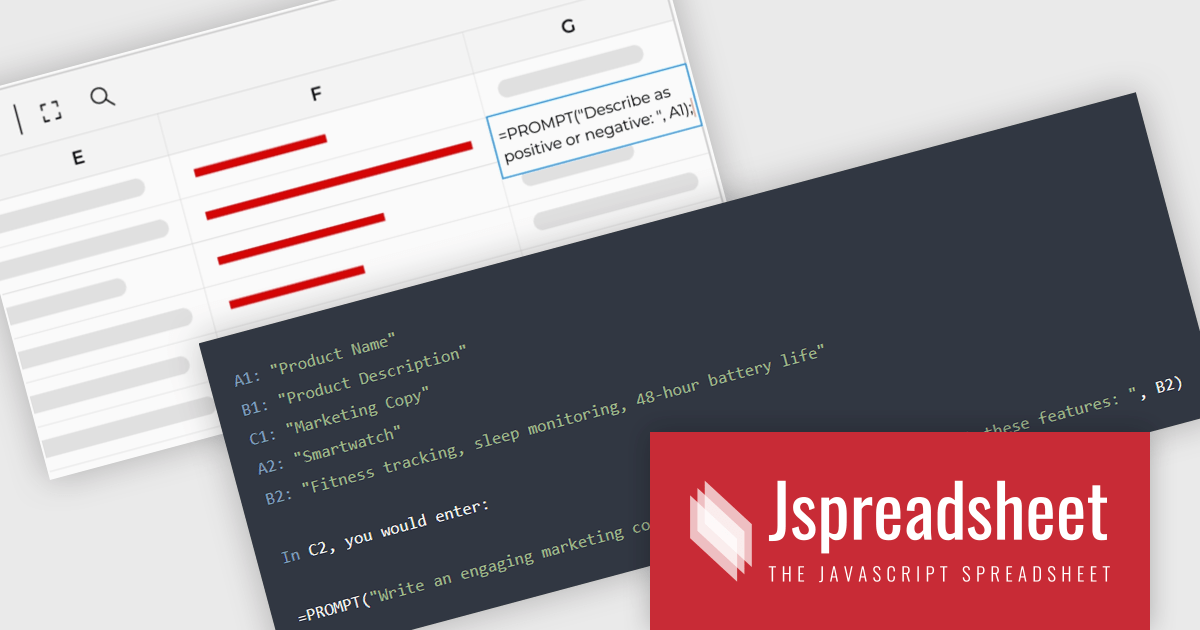
Jspreadsheet Pro is a flexible JavaScript-based spreadsheet solution that enables developers to create customizable, feature-rich data grids for web applications. It offers advanced formulas, data validation, and API integrations. Ideal for tasks like financial modeling, inventory management, and project tracking, it helps businesses efficiently manage and analyze data. Its backend server integration supports real-time data processing, enhancing workflows and boosting productivity across various industries.
Jspreadsheet Pro seamlessly incorporates ChatGPT API into data grids. This integration facilitates automated content generation, efficient response management, and comprehensive data analysis. For full functionality it requires the Jspreadsheet Server extension which enables front-end queries to communicate with the API via your back-end, delivering real-time data and insights to users.
Jspreadsheet Pro is licensed as an Annual or a Perpetual License with support and maintenance. We can supply any Jspreadsheet Pro license including new licenses, maintenance renewals, and upgrade licenses. See our Jspreadsheet Pro for full details.
For more information, visit our Jspreadsheet Pro product page.
電話: (888) 850 9911
Fax: +1 770 250 6199


