


公式サプライヤー
公式および認定ディストリビューターとして200社以上の開発元から正規ライセンスを直接ご提供いたします。
当社のすべてのブランドをご覧ください。

Highcharts is a JavaScript charting framework that allows web developers and data analysts to generate dynamic, visually appealing charts and graphs for websites and web applications. It can display a variety of chart types, including line, spline, area, column, bar, pie, scatter, and many more. Highcharts is well-known for its ease of use, rich documentation, and ability to handle huge datasets efficiently. Features include responsive design, accessibility support, and cross-browser compatibility. Its customization capabilities allow users to create bespoke data visualizations that increase engagement and provide insightful data presentations.
Highcharts has introduced a major update for React developers, focusing on a smoother and more natural experience when working with charts in React applications. The newly refined API now mirrors common React patterns, allowing developers to write less boilerplate and avoid workarounds. Integration is more seamless too - custom React components can be passed directly into chart configurations, enabling dynamic, reusable elements like tooltips and data-fetching containers without resorting to hacks. The update also brings full support for ECMAScript Modules (ESM), aligning with modern JavaScript standards and enabling better build optimization. With this release, Highcharts continues to provide a comprehensive set of chart types, from basic line graphs to advanced stock visualizations, all within a React-friendly environment.
Highcharts Core is licensed on an annual or perpetual basis, OEM licenses, and Advantage Renewals. It is licensed per Developer and has several license options including Internal, SaaS, SaaS+, and Self Hosted. See our Highcharts Core licensing page for full details.
Learn more on our Highcharts Core product page.
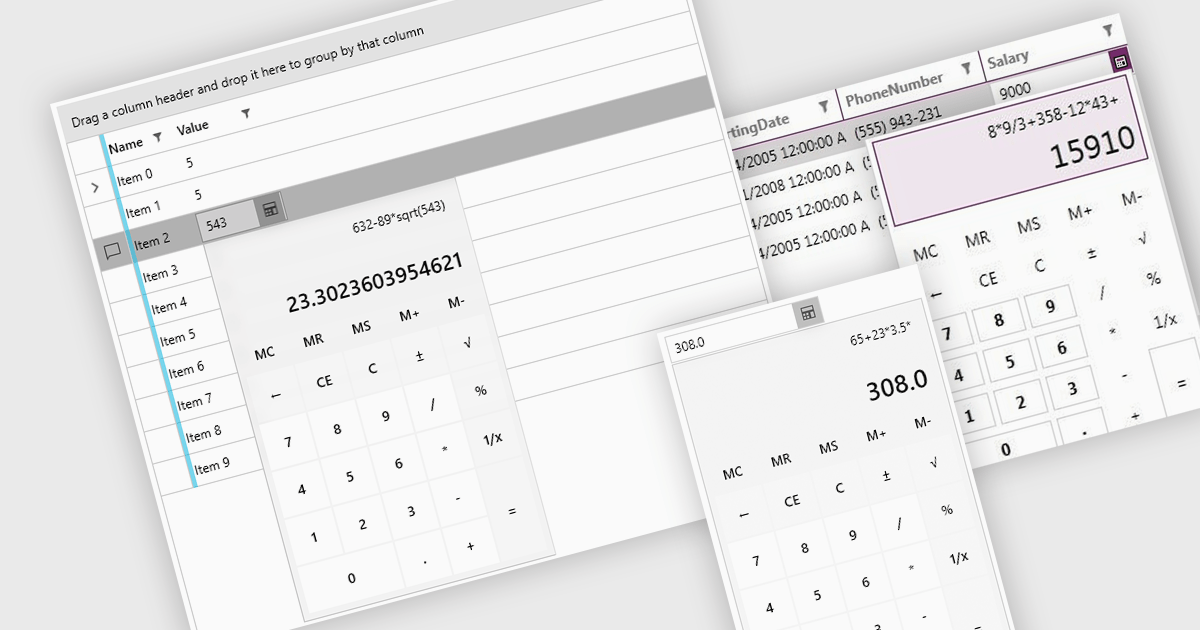
Dropdown calculators are interactive user interface components that integrate a compact calculator directly into a standard dropdown control, allowing users to perform quick calculations or adjust numerical values without navigating away from the current input field. This interaction pattern is particularly useful in data-heavy applications where users frequently need to input or modify numerical data, such as e-commerce pricing, financial tools, form-based systems, or configuration panels. By integrating calculation capabilities directly into the dropdown, these components reduce the need for external tools, help maintain focus, and improve the overall speed and accuracy of user input.
Several WPF data editor collections offer a dropdown calculator, including:
For an in-depth analysis of features and price, visit our comparison of WPF data editors collections.
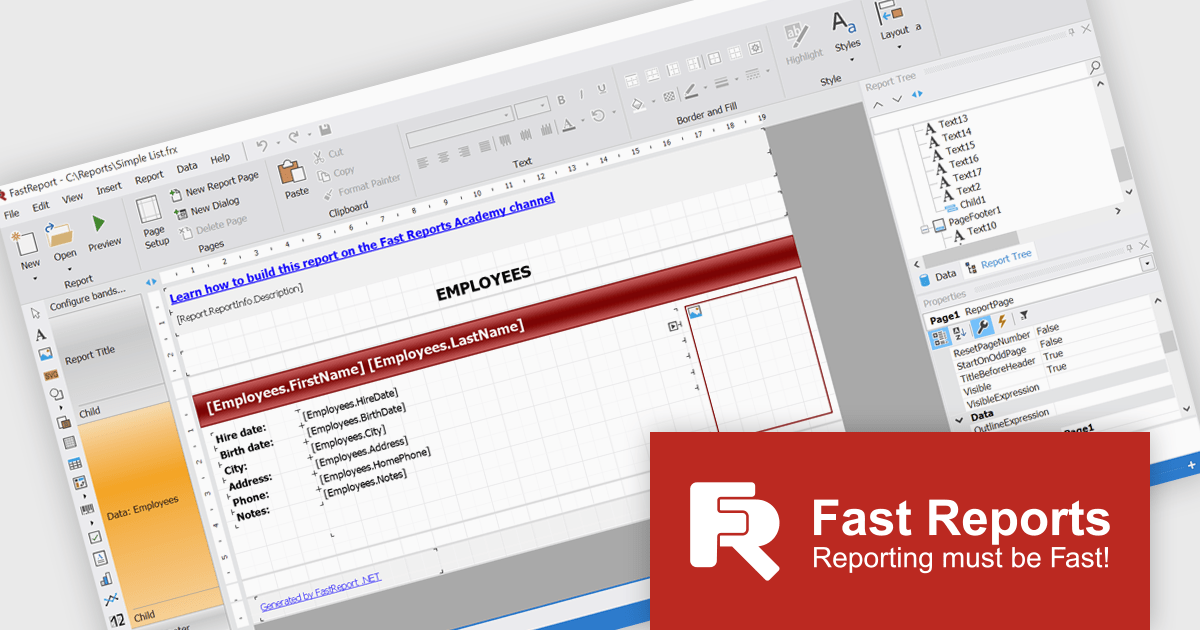
FastReport .NET Ultimate is a comprehensive reporting solution for developers working within the Microsoft .NET ecosystem. It supports the creation, design, and delivery of rich, interactive reports across Windows Forms, ASP.NET, MVC, and .NET Core applications. The Ultimate edition includes server deployment capabilities and extensive export options, such as PDF, Excel, Word, and HTML. It connects to various data sources, including SQL databases and business objects, providing flexibility for enterprise-level reporting. With the integrated FastReport Online Designer, users can edit reports directly in their browsers, enabling efficient collaboration and modern, full-featured report design across both desktop and web platforms.
The FastReport .NET Ultimate 2026.1 update introduces an improved Ribbon interface and a new 'RibbonDesignerControl', giving developers a more intuitive and efficient report design experience. The redesigned Ribbon UI offers a cleaner, more structured layout that simplifies access to tools and settings, improving usability and reducing development time. This addition allows developers to integrate the same modern Ribbon interface directly into their own applications, providing a consistent and familiar design environment for end users. This enhancement supports smoother workflows, greater customization, and a more professional user experience across both desktop and web reporting solutions.
To see a full list of what's new in version 2026.1, see our release notes.
FastReport .NET Ultimate is licensed per named user and is available as a perpetual license with a one-year subscription for updates and support. See our FastReport .NET Ultimate licensing page for full details.
For more information, visit our FastReport .NET Ultimate product page.
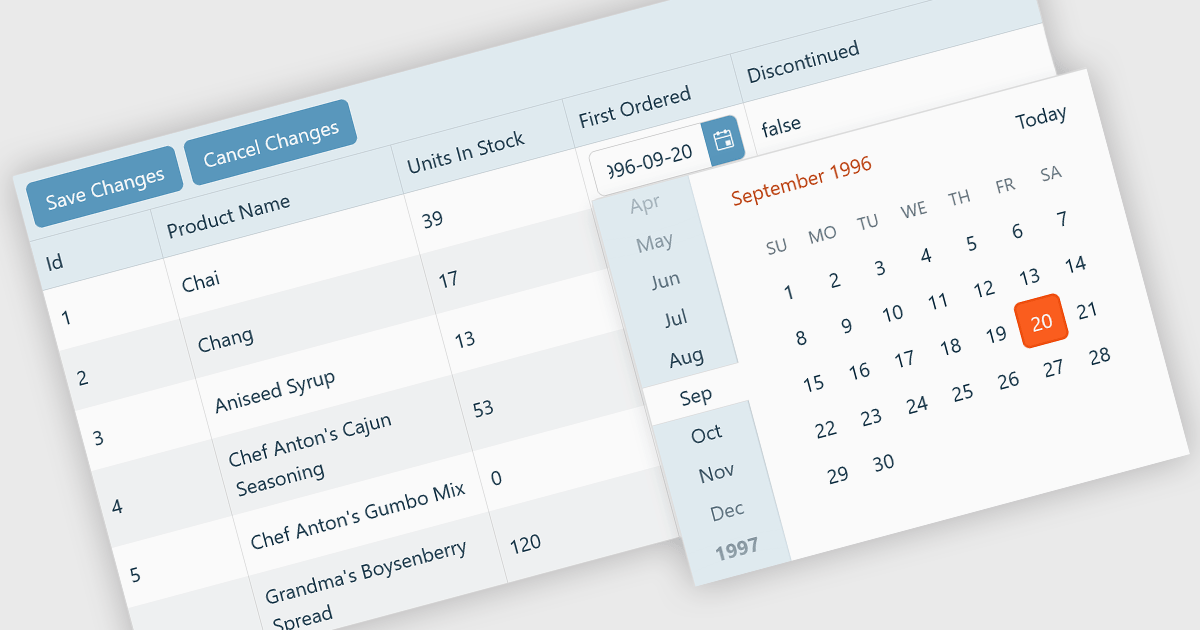
A custom grid editor allows developers to tailor how users interact with data directly within grid cells, providing a flexible and efficient editing experience. Instead of relying on standard text inputs, custom editors can include dropdowns, sliders, toggles, or calendar components to match the data type. This approach not only improves data entry and validation but also enhances accuracy and user satisfaction by ensuring inputs are contextually relevant. For example, a date field might use an inline date picker, while a status column could feature a dropdown with predefined options. Ideal for data-heavy applications such as dashboards, scheduling tools, and administrative panels, custom grid editors help users to edit complex data quickly and intuitively without leaving the main interface.
Several React Grid controls offer support for custom editing including:
For an in-depth analysis of features and price, visit our comparison of React Grid controls.
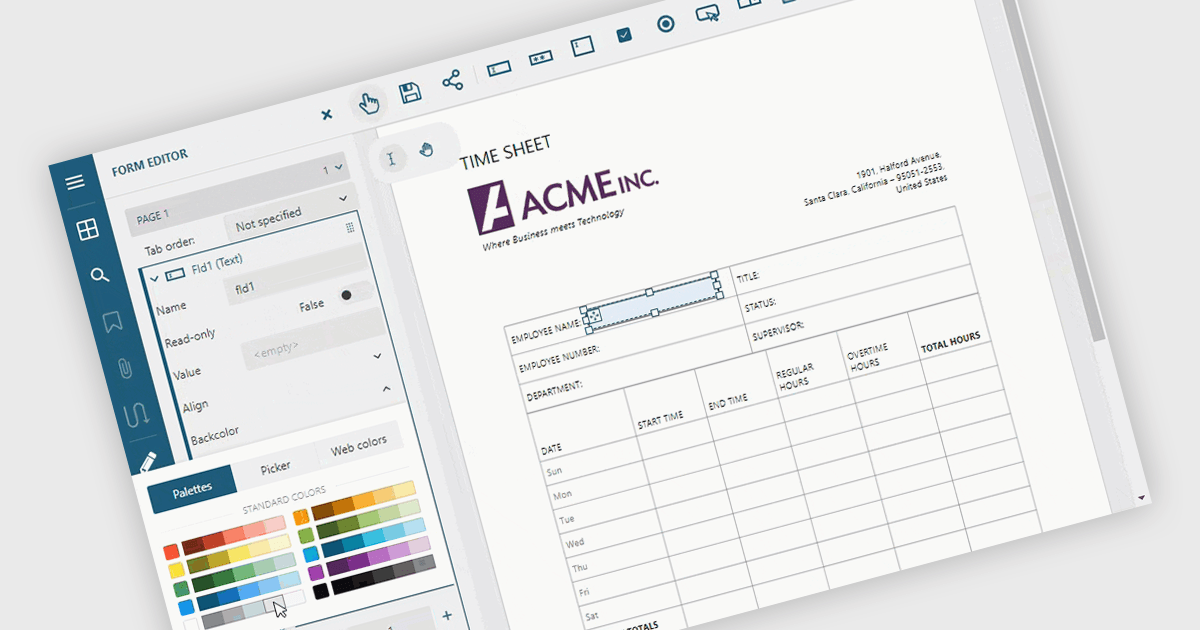
Adding and modifying form fields in PDF editing provides full control over form design and content. It lets users insert, modify, delete, or rename interactive fields such as text boxes, checkboxes, and signature areas to keep forms accurate and up to date. Visual customization, including adjusting field colors and layouts, helps create professional, branded documents. Common uses include updating HR application forms, refining finance templates, and simplifying legal agreements for faster completion.
Several ASP.NET Core PDF components allow you to add, edit and remove form fields from PDF forms, including:
For an in-depth analysis of features and price, visit our comparison of ASP.NET Core PDF components.
電話: (888) 850 9911
Fax: +1 770 250 6199


