


公式サプライヤー
公式および認定ディストリビューターとして200社以上の開発元から正規ライセンスを直接ご提供いたします。
当社のすべてのブランドをご覧ください。
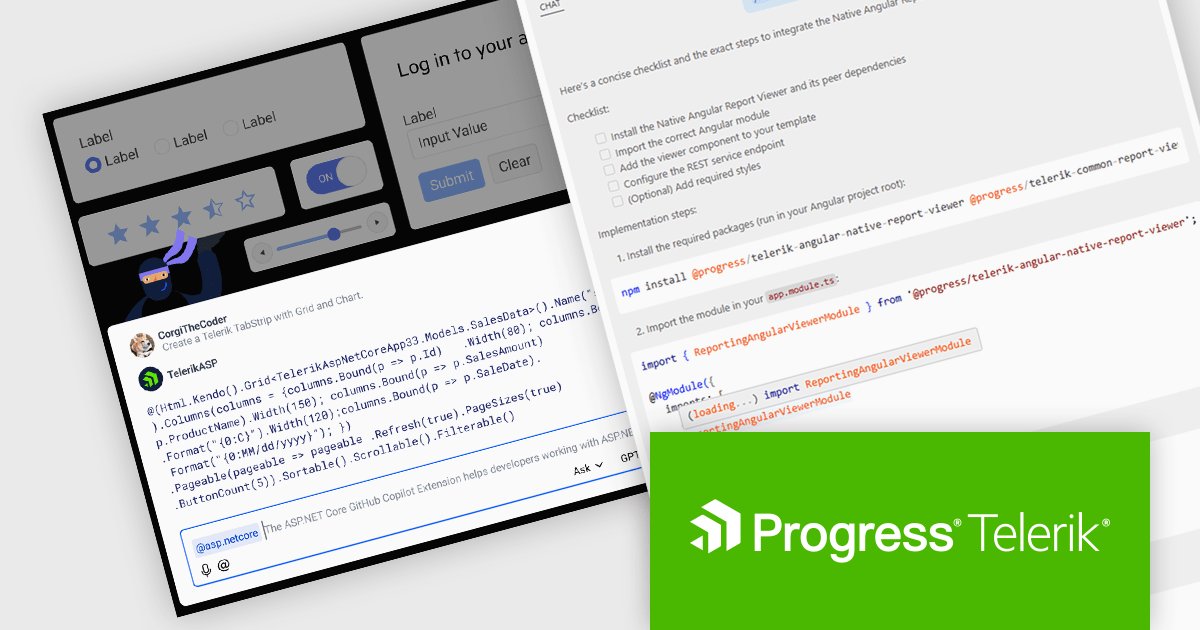
DevCraft by Telerik is a comprehensive suite of more than 1,250 UI components and development tools designed for building modern web, desktop, and mobile applications using .NET and JavaScript frameworks. It includes reporting and report management solutions, automated testing and mocking tools, and document processing libraries, as well as a wide range of professionally designed user interface controls from the Telerik and Kendo UI suites. DevCraft enables developers to create feature-rich, high-performance applications with consistent design and user experience, delivering enterprise-level, scalable, and maintainable software solutions.
The Telerik DevCraft 2025 Q3 update extends the availability of the AI coding assistants to all of the major UI libraries. Along side Blazor and React, the AI Coding Assistant is now trained on and available for Kendo UI for Angular, Telerik UI for ASP.NET Core, UI for WPF, UI for WinForms and UI for .NET MAUI, as well as for Telerik Reporting and the Document Processing Libraries. These assistants are GitHub Copilot add-ins and MCP servers that provide context-aware and specialized AI-generated code directly in your IDE using natural language prompts, allowing developers to deliver high quality user interfaces and reporting functionality in web and desktop applications in much less time.
To see a full list of what's new in version 2025 Q3, see our release notes.
Telerik DevCraft is licensed per developer and has two licensing models: an annual Subscription License and a Perpetual License. The Subscription license provides access to the latest product updates, technical support, and exclusive benefits for a flat annual fee, and must be renewed to continue using the software. The Perpetual license is a one-time purchase granting access to the current released version and includes a one-year subscription for product updates and technical support. After this initial period, users can choose to renew the subscription element to continue receiving updates and support; otherwise, they may continue using the installed version available during their active subscription term but will forgo future updates and support. See our Telerik DevCraft Ultimate licensing page for full details.
Telerik DevCraft is available in the following editions:
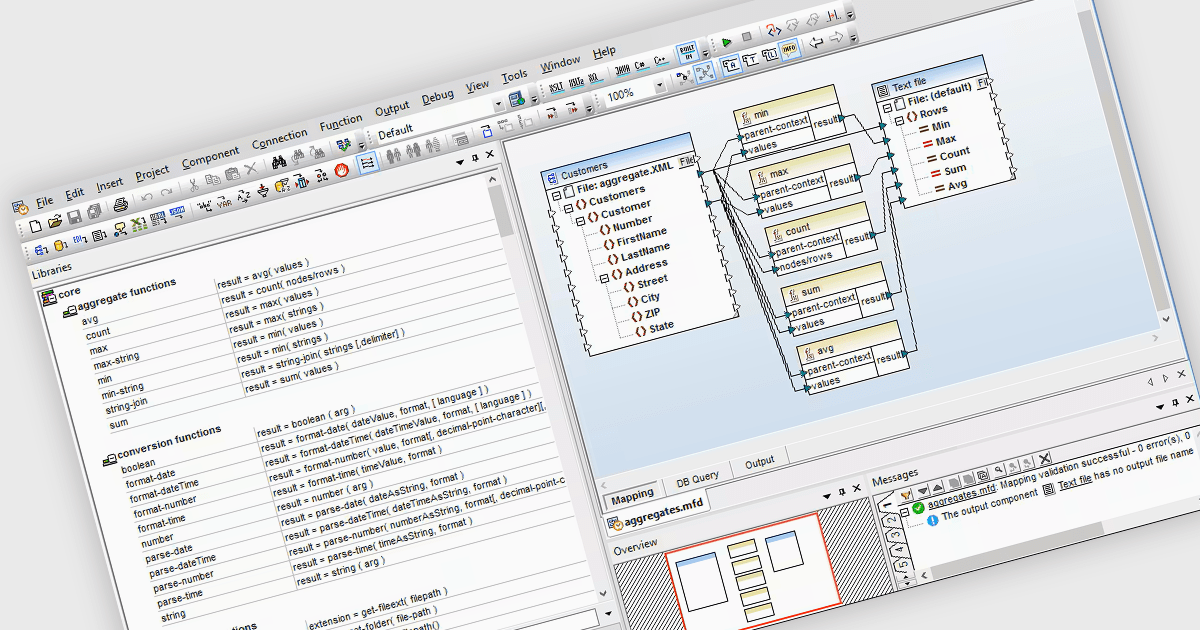
Data Manipulation in a Structured Document Tool refers to the ability to programmatically access, modify, and reorganize data within documents that follow a defined structure, such as XML or JSON. For software developers, this enables precise control over document content, supports dynamic content generation, and facilitates integration with external systems or data sources. It helps ensure consistency across document workflows and allows developers to automate updates, enforce validation rules, and transform data to meet specific application requirements.
Many Structured Document tools offer data manipulation including:
For an in-depth analysis of features and price, visit our comparison of Structured Document Tools.
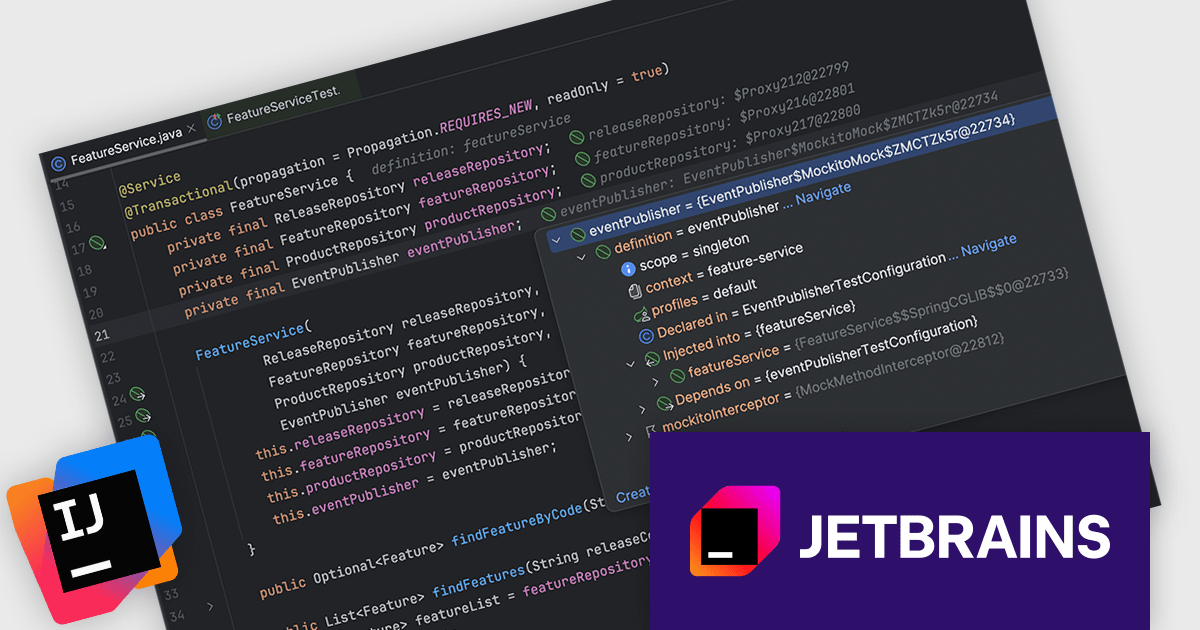
IntelliJ IDEA by JetBrains is an integrated development environment (IDE) designed to maximize developer productivity through intelligent code assistance, deep language understanding, and robust developer tools. Known for its support for Java and a wide array of other languages and frameworks, IntelliJ IDEA offers advanced code completion, on-the-fly analysis, and reliable refactoring tools that accelerate the entire development process. With a strong focus on ergonomics and performance, it enables professionals to write, test, and debug high-quality code faster and with greater confidence.
The IntelliJ IDEA 2025.2 update adds new Spring Debugger, aiming to significantly improve how developers analyze and resolve issues in Spring-based applications. This update provides deep, real-time visibility into application internals directly from the IDE, removing the need to jump between logs, code, and external tools during debugging. Developers can now instantly see which Spring beans are currently loaded or mocked, and evaluate their definitions without restarting the application. This live view extends to resolved configuration values, with precise source tracking - even for values pulled from environment variables or profile-specific settings. This can help teams pinpoint misconfigurations much faster.
To see a full list of what's new in version 2025.2 see our release notes.
IntelliJ IDEA is licensed per user as a commercial annual subscription. We can supply New Subscriptions, Subscription Renewals, Lapsed Subscription Renewals, and Additional Developer Licenses. See our IntelliJ IDEA licensing page for full details.
IntelliJ IDEA is available to buy in the following products:
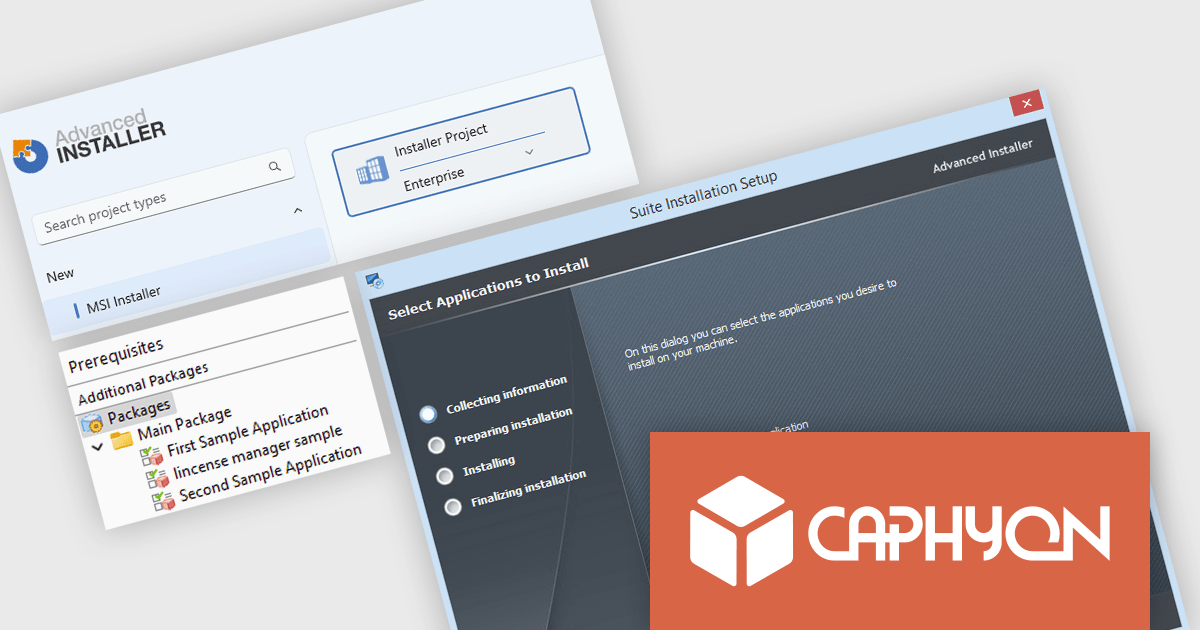
Advanced Installer by Caphyon is a versatile software packaging tool used by developers, IT administrators, and software vendors to create reliable, professional-grade installation packages. It simplifies the deployment process for applications across various platforms, offering features like built-in compliance checks, configuration of server roles, and seamless integration with development frameworks. By automating complex tasks, it helps teams save time and reduce errors, making it an indispensable tool for deploying enterprise applications, client-server solutions, and cloud-connected software.
The Advanced Installer 23.0 update introduces the new Suite Installer, allowing developers to bundle multiple applications into a single, customizable installer that reflects their brand identity. This enhancement simplifies deployment by centralizing installation and updates, while offering end users a more refined experience where they can select only the applications they need. By combining flexibility for users with efficiency for developers, the Suite Installer reduces complexity, saves time, and ensures a more professional and consistent delivery process.
To see a full list of what's new in version V23.0, see our release notes.
Advanced Installer is licensed per user and is available as an annual or perpetual license with 1 year support and maintenance. See our Advanced Installer licensing page for full details.
For more information, visit our Advanced Installer product pages:
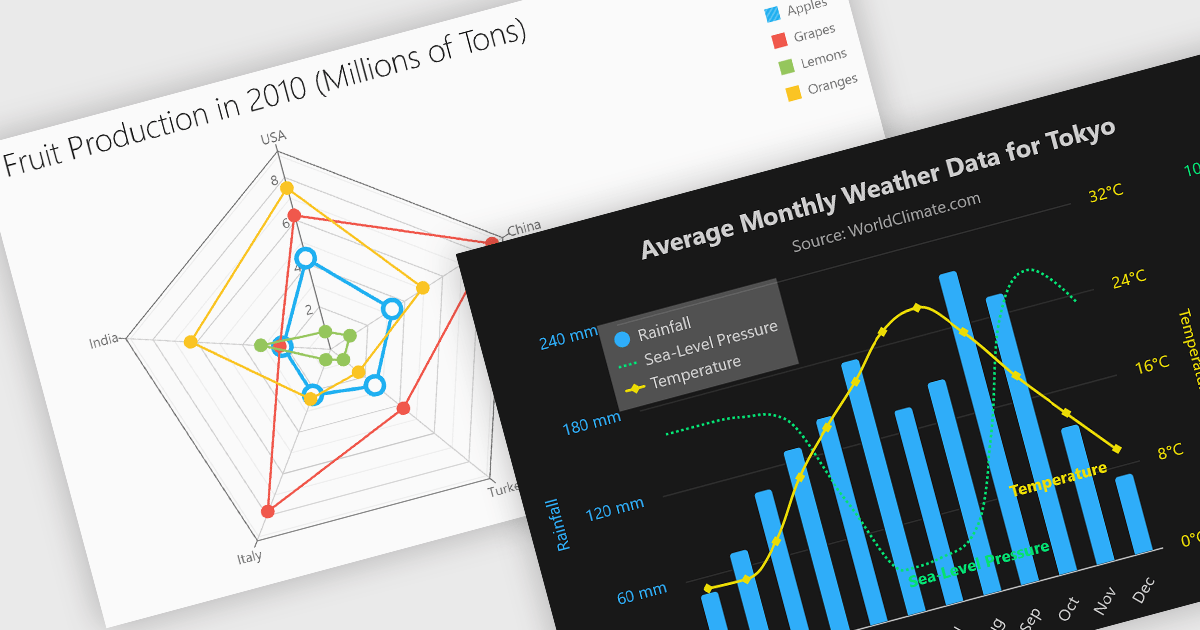
Multi-dimensional and relationship charts allow developers to present complex data structures and inter-variable relationships in a way that’s visually intuitive and analytically powerful. These chart types are essential for exploring correlations, comparing grouped metrics, and visualizing distributions across multiple dimensions. They are commonly used in statistical dashboards, performance analysis tools, and scientific applications where simple line or bar charts aren’t sufficient to capture the full context of the data.
Common charts include:
For an in-depth analysis of features and price, visit our Angular Chart components comparison.
電話: (888) 850 9911
Fax: +1 770 250 6199


