


公式サプライヤー
公式および認定ディストリビューターとして200社以上の開発元から正規ライセンスを直接ご提供いたします。
当社のすべてのブランドをご覧ください。
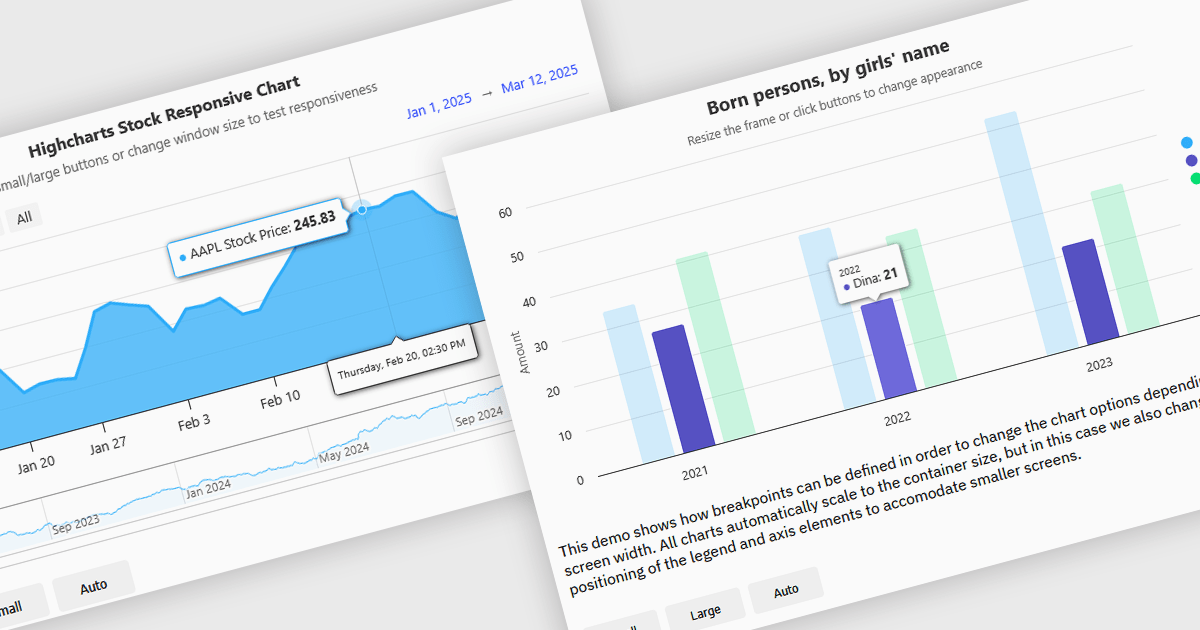
Responsive charts are dynamic data visualizations that automatically adjust to different screen sizes, resolutions, and devices, ensuring a seamless user experience across desktops, tablets, and mobile phones. By adapting elements such as labels, tooltips, legends, and axes, they enhance readability, improve accessibility, and maintain consistent data presentation. These charts optimize performance by efficiently rendering content and supporting interactive features like zooming, panning, and touch gestures. Developers use responsive charts in a wide range of applications, including financial reports, business intelligence dashboards, real-time monitoring systems, and interactive analytics tools, providing users with clear and accessible insights regardless of their device.
Several React charts offer responsive chart support, including:
For an in-depth analysis of features and price, visit our React chart comparison.
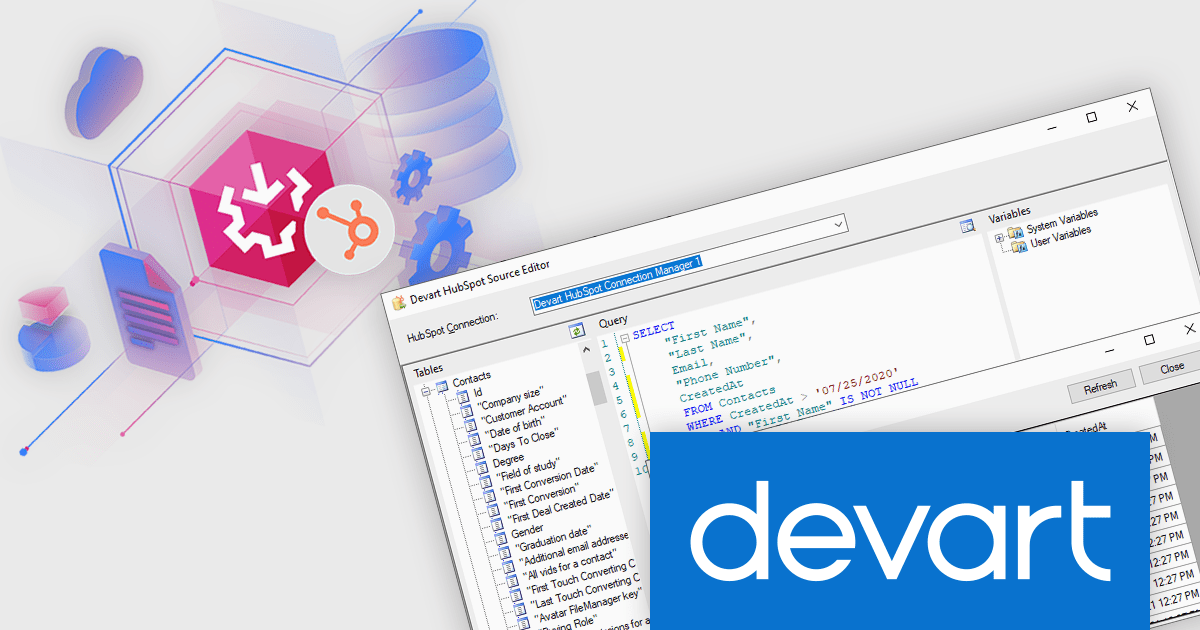
Devart SSIS Data Flow Components for HubSpot provide a seamless way to integrate HubSpot data with SQL Server and other databases. These components allow users to easily extract, transform, and load (ETL) data between HubSpot and various destinations, streamlining workflows and automating business processes. With built-in support for HubSpot’s API, the solution ensures high performance and reliability when handling large datasets, making it a valuable tool for developers and data engineers working with marketing, sales, and customer service data.
The Devart SSIS Data Flow Components for HubSpot V3.1.740 release adds support for the HubSpot Conversations API enabling direct interaction with messaging-related data. This enhancement allows users to work with Messages, Threads, Inboxes, Channels, ChannelAccounts, and Actors objects, offering deeper insights into customer communications. Businesses can now efficiently extract and analyze conversational data, automate responses, and synchronize interactions with other systems. This leads to improved customer engagement, better support management, and enhanced data-driven decision-making across various teams.
To see a full list of what's new in V3.1.740, see our release notes.
Devart SSIS Data Flow Components for HubSpot is licensed per developer or per server and is available as an Annual or Perpetual License with a 12 month support and maintenance subscription. See our Devart SSIS Data Flow Components for HubSpot licensing page for full details.
Devart SSIS Data Flow Components for HubSpot is available individually or as part of Devart SSIS Universal Bundle.
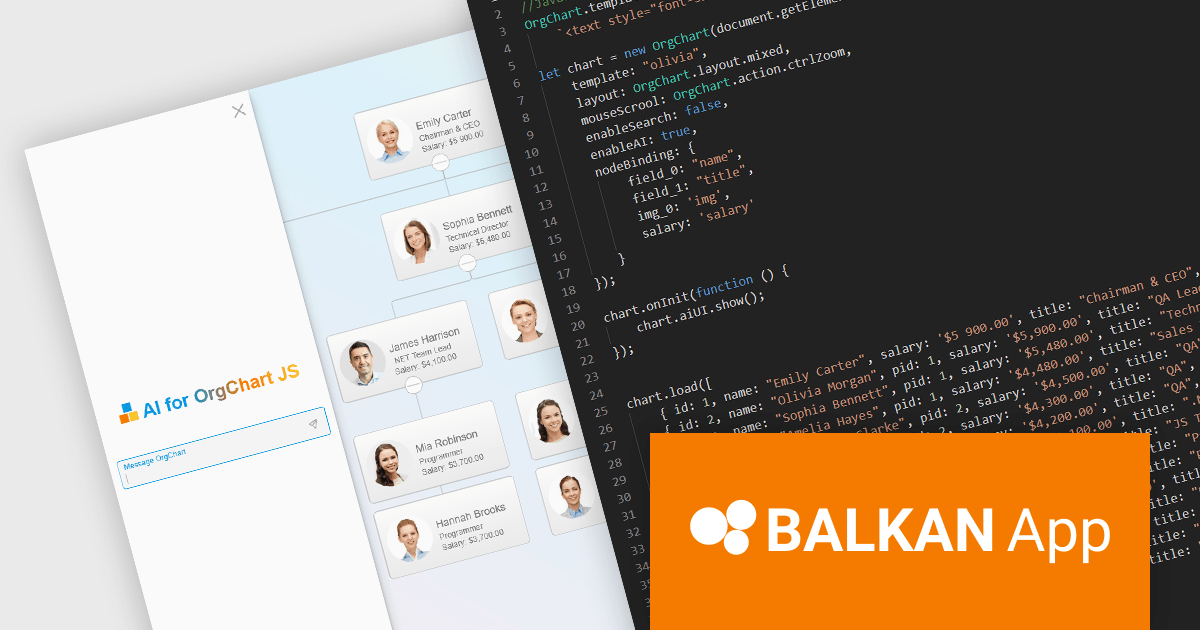
OrgChart JS by BALKAN App is a JavaScript library designed for creating flexible, interactive and customizable organizational charts for presenting structural data. This visual tool helps managers illustrate the roles and hierarchy of an organization, supporting a variety of features, including grouping, assistant nodes, expand/collapse, a built-in search field, and multi-format exports for example to PDF, PNG, SVG or CSV. Compatible with all modern browsers, it supports thousands of nodes without any impact on performance, and offers extensive customization, giving users a versatile and efficient tool for visualizing hierarchical data structures in web applications.
The OrgChart JS v8.15 update introduces AI capabilities that enhance the creation and management of organizational charts. Developers can now utilize natural language commands to manipulate chart data, such as adding or moving employees, adjusting salaries and customizing visual elements. The integration of artificial intelligence improves the process of maintaining accurate and efficient organizational charts within applications.
To see a full list of what's new in v8.15, see our release notes.
OrgChart JS is licensed based on usage, offering single website, unlimited websites or SaaS, and OEM licenses. It is available as a perpetual license with 1 year maintenance and technical support. See our OrgChart JS licensing page for full details.
For more information, see our OrgChart JS product page.
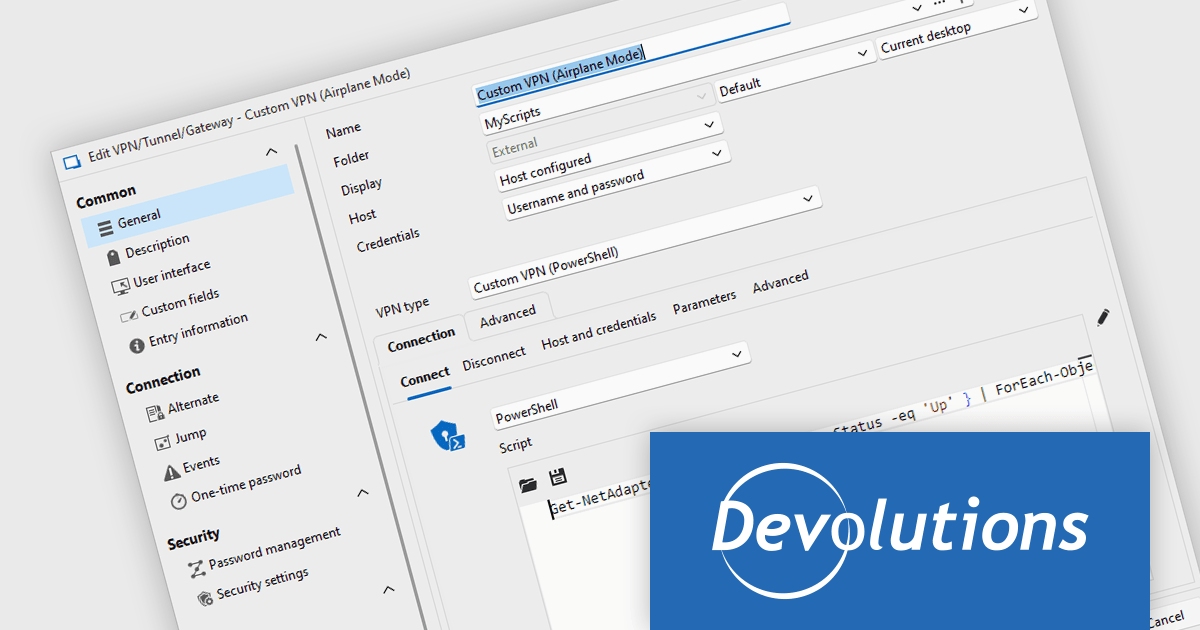
Remote Desktop Manager (RDM) by Devolutions (available in Windows, macOS or Linux editions) is a centralized platform designed for managing and securing remote connections and credentials for authorized users across various environments. It supports an extensive list of technologies, including remote desktops, virtual private networks (VPNs), and secure shell (SSH) tunnels, and features centralized password vaults, user-specific vaults, and administrative password sharing. This cross-platform management tool also allows you to perform audits and create reports, as well as offering mobile and offline access, and integrated virtualization consoles. RDM provides a comprehensive solution for IT professionals and developers who need to streamline access to servers, virtual machines, and network devices.
The Remote Desktop Manager 2025.1.24.0 update (Windows Edition) adds the ability to create a custom VPN using a PowerShell script for connect and disconnect actions. This feature gives developers greater flexibility in automating and personalizing secure remote connections, and is ideal for setting up integrations with VPNs that aren't natively supported, such as Tailscale. It allows developers to integrate complex authentication workflows, dynamically configure VPN parameters, and adapt to specific network environments without relying on static VPN configurations. By leveraging PowerShell, users can align remote access behavior with evolving infrastructure and security policies, resulting in more efficient and controlled connection management.
To see a full list of what's new in 2025.1.24.0, see our release notes.
Remote Desktop Manager is licensed per user and is available as a 1 or 3 year subscription license, however perpetual licenses are available upon request. Subscriptions include maintenance and perpetual licenses can have maintenance added, this provides new versions and technical support for the duration of the subscription/maintenance period. See our Remote Desktop Manager licensing page for full details.
For more information, visit our Remote Desktop Manager product page.
KendoReact by Telerik is a comprehensive library of UI components specifically designed for building modern, feature-rich React applications, enabling developers to create intuitive, responsive, and visually appealing interfaces with ease. It includes robust components like data grids, charts, form elements, and navigation tools, optimized for high performance with features such as virtualization for large datasets and adherence to accessibility standards. Ideal for dashboards, enterprise apps, and data-driven applications, KendoReact empowers teams to accelerate development, ensure design consistency, and deliver inclusive user experiences.
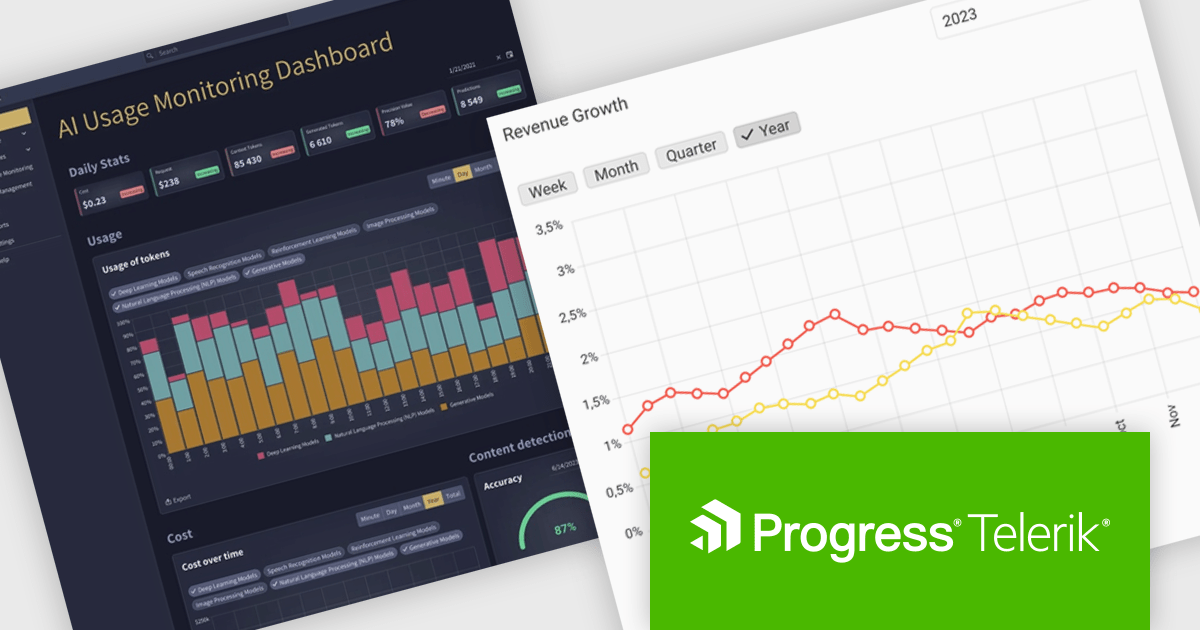
The KendoReact v9.4.0 update enhances UI development efficiency by introducing 12 new Building Blocks, including Dashboard Cards, an AI App Welcome Screen, an AI-powered Editor, and an AI Usage Monitoring Dashboard Template. These pre-configured components, seamlessly integrated with KendoReact, enable developers to accelerate application design, maintain consistency, and reduce implementation effort. By leveraging these ready-to-use elements, teams can focus on building functionality rather than UI assembly, ensuring faster delivery of modern, AI-driven applications with a polished user experience.
To see a full list of what’s new in 2025 Q1 (v9.4.0), see our release notes.
KendoReact is licensed per developer and has two licensing models: an annual Subscription License and a Perpetual License. The Subscription license provides access to the latest product updates, technical support, and exclusive benefits for a flat annual fee, and must be renewed to continue using the software. The Perpetual license is a one-time purchase granting access to the current released version and includes a one-year subscription for product updates and technical support. After this initial period, users can choose to renew the subscription element to continue receiving updates and support; otherwise, they may continue using the installed version available during their active subscription term but will forgo future updates and support. See our KendoReact licensing page for full details.
KendoReact is available individually or as part of the following products:
電話: (888) 850 9911
Fax: +1 770 250 6199


