


公式サプライヤー
公式および認定ディストリビューターとして200社以上の開発元から正規ライセンスを直接ご提供いたします。
当社のすべてのブランドをご覧ください。
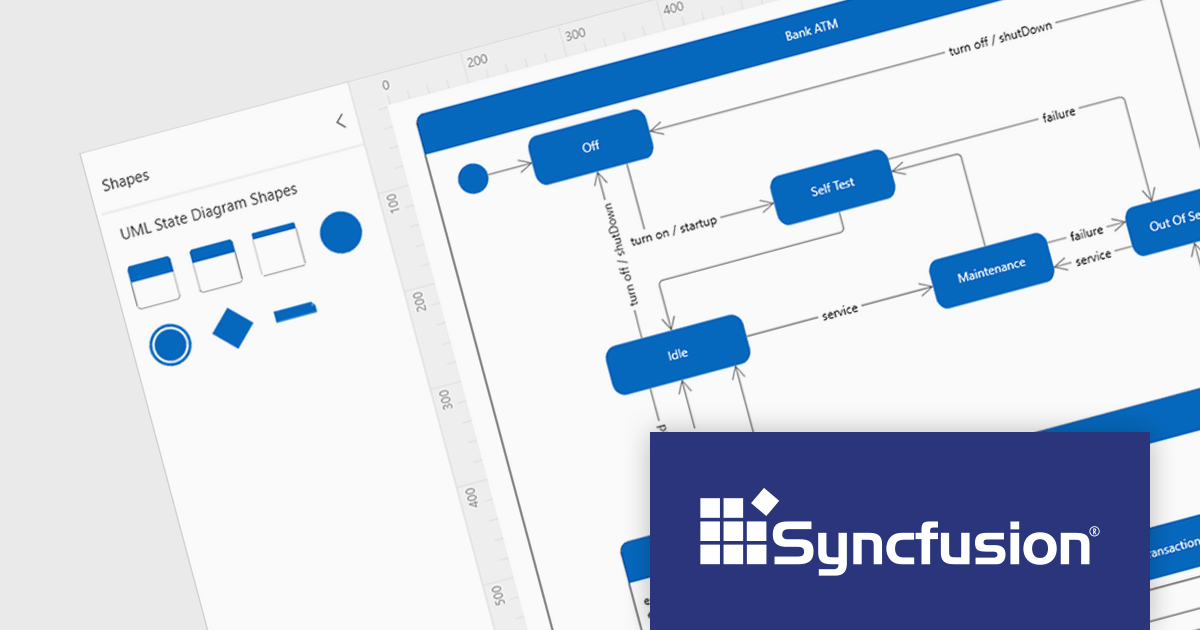
Syncfusion Essential Studio WPF, available as part of Syncfusion Essential Studio Enterprise, is a powerful suite of over 95 UI controls, 50+ charts, and document processing libraries designed to boost the development of high-performance line-of-business applications for the Windows Presentation Foundation (WPF) framework. With built-in themes, touch-friendly interfaces, and seamless Visual Studio integration, it empowers developers to craft modern, feature-rich, and cross-platform experiences with ease.
Version 2023 Volume 4 (24.1.41) adds the ability to create UML (Unified Modeling Language) state diagrams both programmatically and interactively using built-in UML state diagram symbols. This allows you to code your diagrams for robust automation and maintainability, or visually design intricate logic with built-in symbols. UML state diagrams visually depict the dynamic behavior of an object or system, focusing on the finite states it can occupy and the events that trigger transitions between them. These diagrams showcase the system's life cycle, highlighting valid sequences of events and ensuring predictable responses.
To see a full list of what's new in version 2023 Volume 4 (24.1.41), see our release notes.
Syncfusion Essential Studio WPF is available as part of Syncfusion Essential Studio Enterprise which is licensed per developer starting with a Team License of up to five developers. It is available as a 12 Month Timed Subscription License which includes support and maintenance. See our Syncfusion Essential Studio Enterprise licensing page for full details.
For more information, visit our Syncfusion Essential Studio WPF product page.
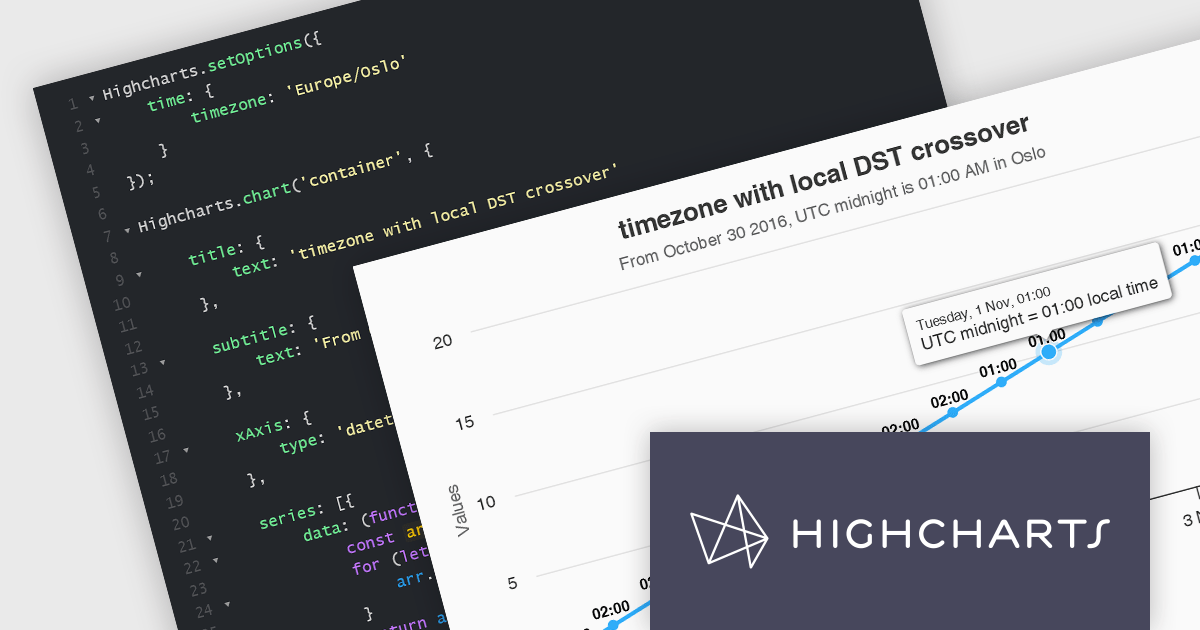
Highcharts is a powerful and versatile JavaScript charting library that empowers developers to create interactive and visually appealing data visualizations for web and mobile applications. Renowned for its extensive chart types, from line and bar charts to heatmaps and gauges, Highcharts boasts advanced customization options, allowing you to tailor layouts, colors, and behaviors to seamlessly integrate with your project's aesthetic and functionality.
The Highcharts v11.3.0 release delivers enhanced datetime support with native handling of the time.timezone option. This streamlined approach leverages the browser's built-in time zone capabilities, ensuring compatibility and accuracy. For browsers that don't recognize a timezone, Highcharts provides a clear warning and defaults to the UTC. By eliminating the dependency on moment.js, Highcharts reduces library weight and improves overall project performance.
To see a full list of what’s new in version 11.3.0, see our release notes.
Highcharts is licensed per developer as an Annual or Perpetual License with Internal, Saas, SaaS+ and OEM distribution options. The annual license includes support and all product updates for 1 year and must be renewed to continue to use the software. The perpetual license includes an "Advantage Subscription" for 1 to 5 years which provides support and updates for that period. If you do not renew Advantage then you may continue to use the software at the last release available during the active Advantage period. See our Highcharts Core licensing page for full details.
Highcharts Core is available as part of the following products:
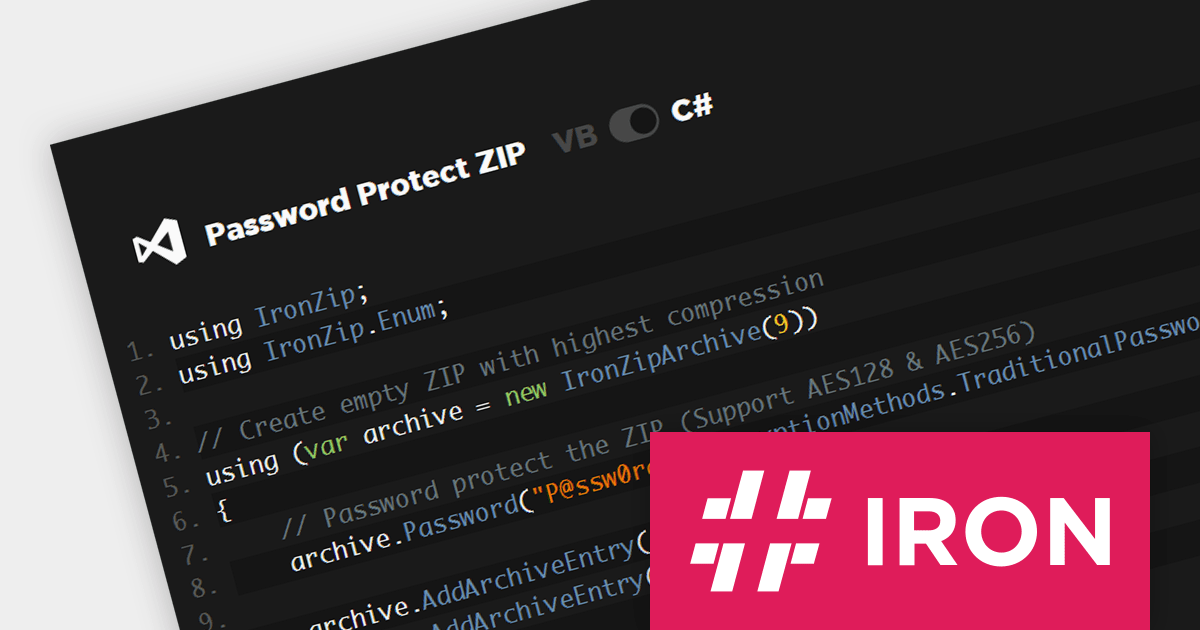
IronZIP for .NET is a powerful and easy-to-use C# ZIP archive library that can be integrated seamlessly into any .NET project. It enables developers to build archives from a multitude of file formats, such as images, text files, documents, audio, and already-compressed files. It also provides support for opening and exporting archives in ZIP, TAR, GZIP, and BZIP2 formats, as well as compressing archives with custom compression levels.
The IronZIP for .NET 2024.1.1 strengthens data security by offering various encryption options. It now supports the traditional password-based method as well as ultra-strong AES (Advanced Encryption Standard) ciphers with 128-bit and 256-bit keys, meeting diverse security needs within ZIP files. This empowers developers to safeguard sensitive data while adhering to tight regulations and industry best practices.
To see a full list of what's new in 2024.1.1, see our release notes.
IronZIP for .NET is available as a perpetual license, with 1 year of product updates and support services, and is licensed per developer. For different development and distribution requirements, Lite, Plus and Professional Licenses are available. See our IronZIP for .NET licensing page for full details.
IronZIP for .NET is available to buy in the following products:

InstallShield by Revenera is a leading Windows installation development solution that specializes in building installers and managing software packages. InstallShield offers a streamlined interface and comprehensive features, enabling developers to efficiently create professional installers, configure prerequisites, manage updates, and customize the installation experience for diverse user needs.
Version 2023 R2 introduces new signing settings that enable you to select and configure a custom signing solution instead of the standard InstallShield signing system. Selecting a custom signing type enables additional fields where the custom signing utility path and other arguments can be configured.
To see a full list of what's new in version 2023 R2, see our release notes.
InstallShield is licensed per user and is available as a 3 Year Timed Subscription. See our InstallShield licensing page or InstallShield Premier licensing page for full details.
For more information, visit our InstallShield or InstallShield Premier product pages.
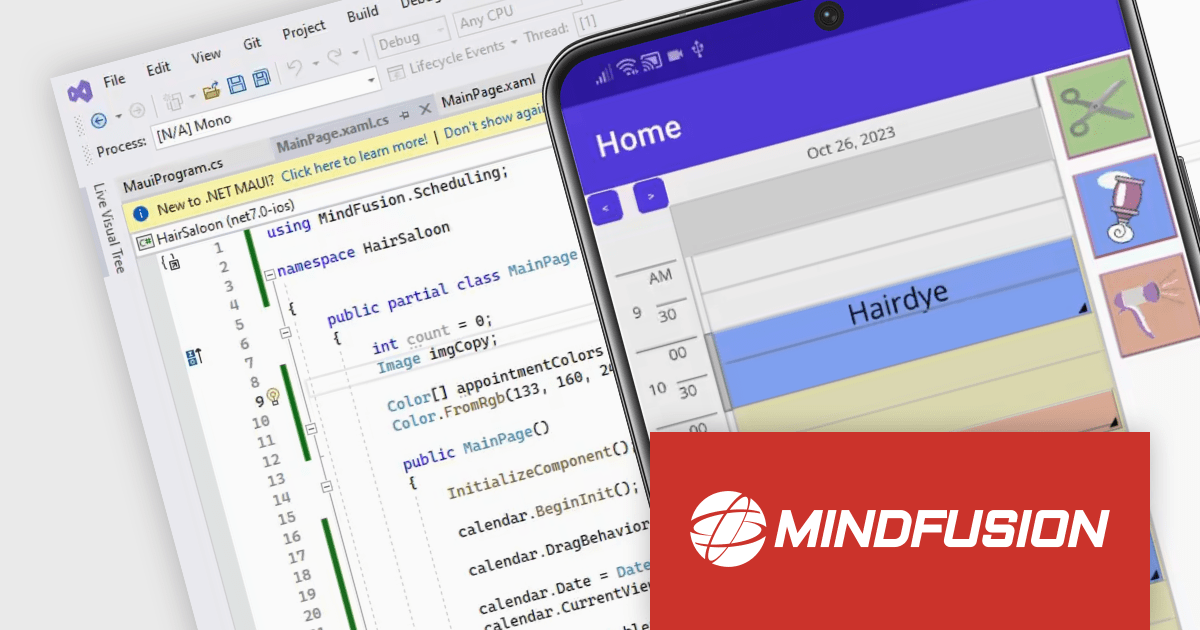
MindFusion Scheduling for .NET MAUI is a powerful scheduling library designed to enhance your cross-platform applications with robust calendar and scheduling functionalities. It seamlessly integrates with .NET MAUI, allowing you to build responsive and interactive calendar views on Android, iOS, Windows, and macOS.
The library boasts five distinct calendar views: single month, timetable (horizontal and vertical), list view, resource view, and week range view. Each view offers extensive customization options through dedicated settings classes, empowering you to tailor the appearance to match your app's design and user preferences. You can control everything from cell size and text rotation to scroll behavior and header content.
MindFusion Scheduling goes beyond mere aesthetics, enabling users to interact intuitively with your app's schedule. They can create, edit, and resize appointments directly within the calendar, with the interface automatically adjusting to accommodate changes.
MindFusion.Scheduling for .NET MAUI is available in the following products:
電話: (888) 850 9911
Fax: +1 770 250 6199


