


公式サプライヤー
公式および認定ディストリビューターとして200社以上の開発元から正規ライセンスを直接ご提供いたします。
当社のすべてのブランドをご覧ください。
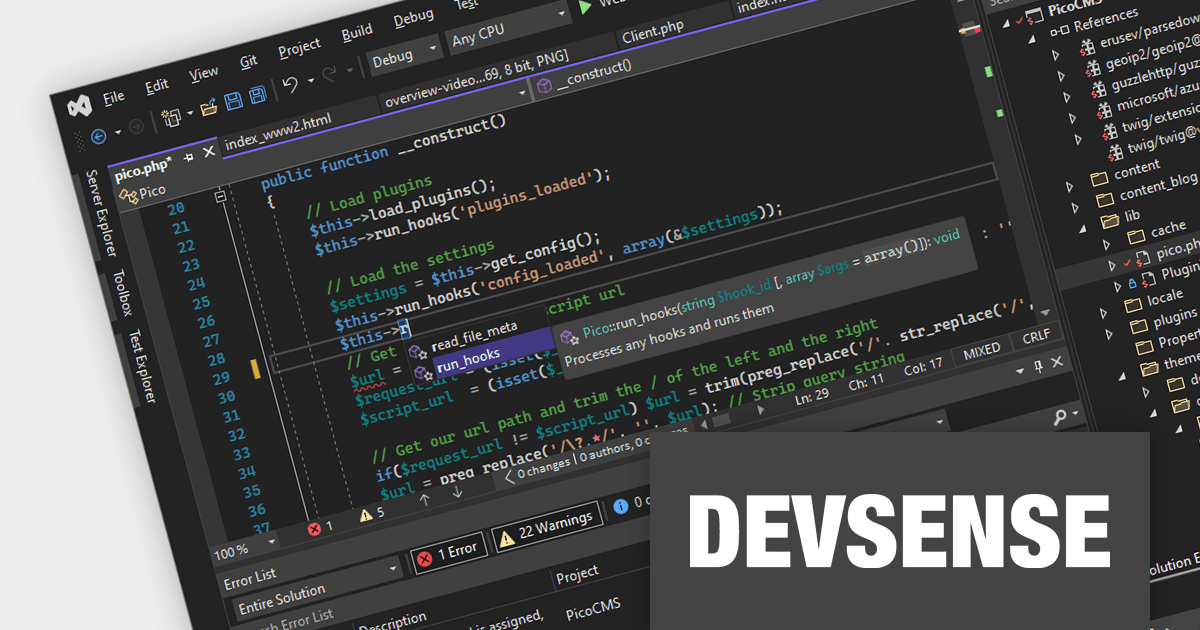
PHP Tools for Visual Studio is an extension designed to enhance Visual Studio with PHP editing features such as code folding and syntax highlighting. Its formatter automatically formats your code when you type, making it easier to follow. PHP Tools for Visual Studio can also normalize spaces, aligning with Visual Studio conventions, and handles mixed HTML and PHP content.
PHP Tools v1.76 gains support for PHP 8.3 syntax, allowing you to target the latest version of the PHP language whilst maintaining correctly formatted code. PHP 8.3 syntax features include typed class constants, anonymous readonly classes, and dynamic class constant fetch.
To see a full list of what's new in v1.76.18866, see our release notes.
For more information, see our PHP Tools for Visual Studio product page.
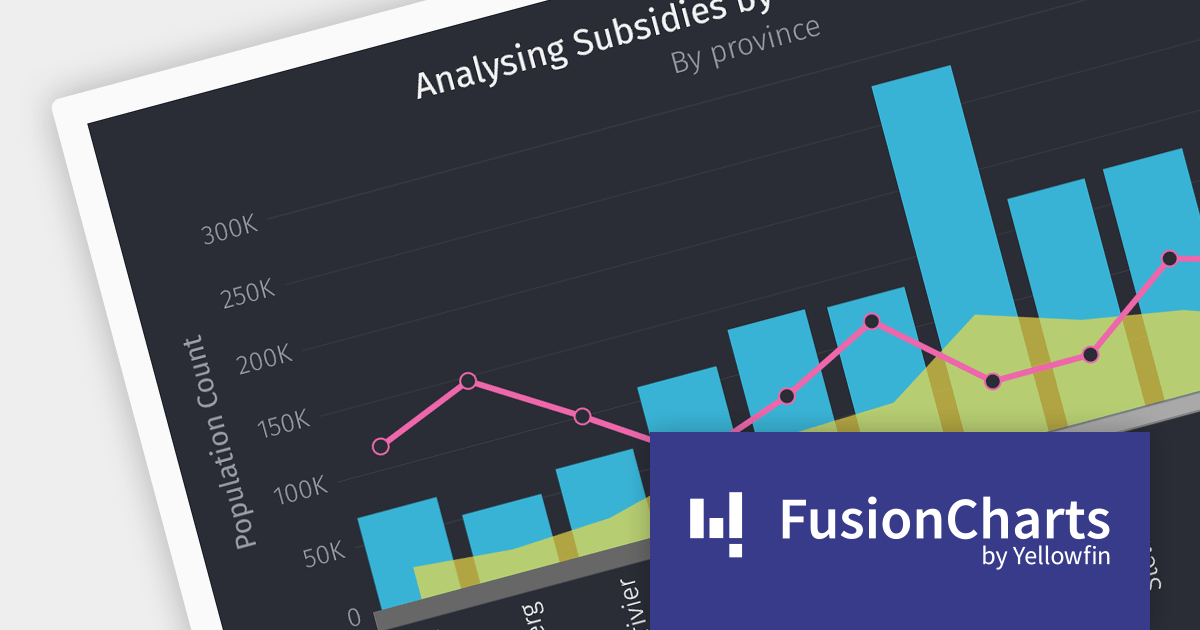
FusionCharts Suite XT is a powerful collection of charting and mapping tools that helps developers create interactive and data-driven dashboards for their web and mobile applications. It provides a wide range of features, including over 100 chart types, data-driven maps, and a variety of customization options. FusionCharts Suite XT helps you visualize and present data in a clear and engaging way.
The FusionCharts Suite XT v3.22 release introduces seamless integration with Blazor, allowing you to create visually appealing and informative data visualizations that enhance the overall user experience. These visualizations offer feature-rich configuration options that boost charting performance, enabling efficient client-side rendering and fast chart display, even with large datasets.
To see a full list of what's new in v3.22, see our release notes.
For more information, visit our FusionCharts Suite product page.
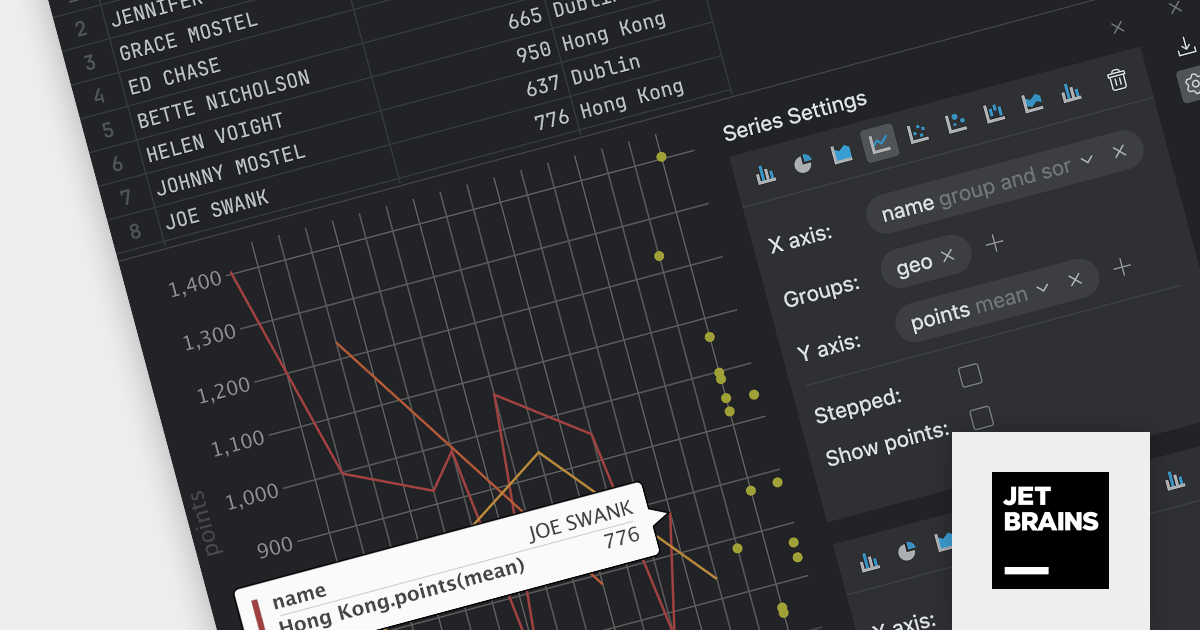
DataGrip is a multi-engine database environment that supports MySQL, PostgreSQL, Microsoft SQL Server, Oracle, Sybase, DB2, SQLite, HyperSQL, Apache Derby and H2. It includes an editor that provides intelligent coding assistance such as auto-completion, analysis and navigation. It also features a query console for running and profiling queries.
The DataGrip 2023.3 release seamlessly integrates charts within the data editor using the Lets-Plot library, allowing you to easily visualize query results and database object data. It offers a range of chart types including bar, pie, area, line, scatter, bubble, and stock charts. DataGrip intelligently selects the most suitable default chart type based on the data types involved, ensuring optimal data presentation and analysis.
Data can be grouped to uncover meaningful patterns and trends, and charts can be exported to PNG format. For database objects and DSV files, the chart is displayed alongside the table in split-view mode. In contrast, for in-editor results and query results shown in the Services tool window, the chart view replaces the table.
To see a full list of what's new in version 2023.3, see our release notes.
For more information, visit our DataGrip product page.
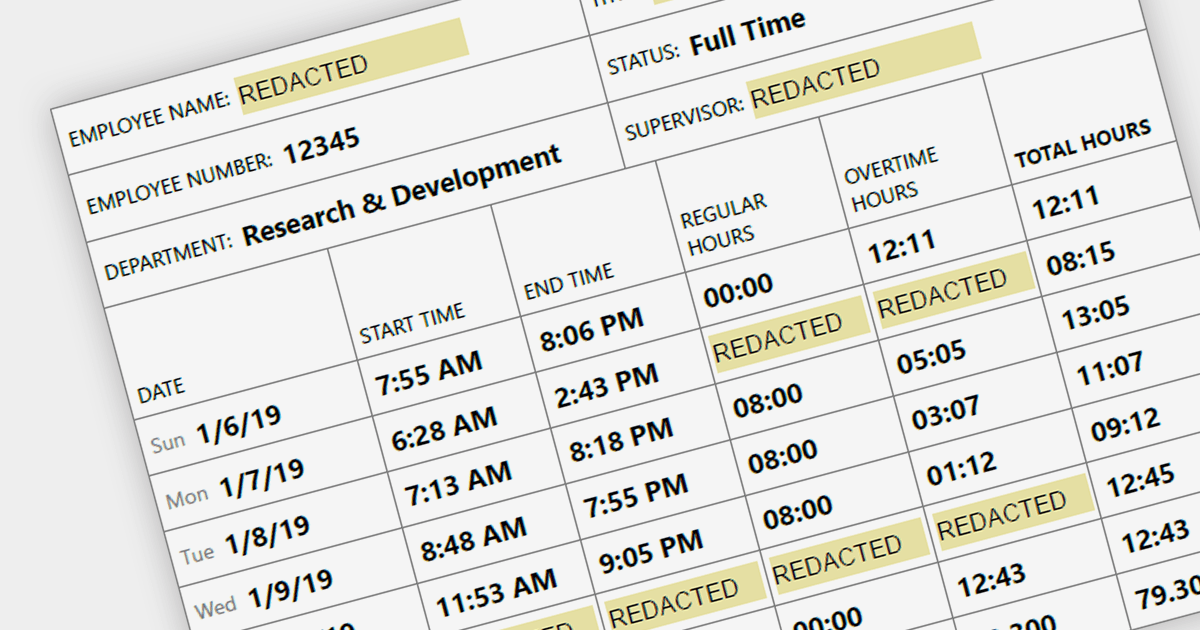
Redaction functionality provides a secure and efficient way to remove sensitive or confidential information from digital documents. This feature is crucial for organizations that handle sensitive data, ensuring compliance with data privacy regulations and safeguarding sensitive information from unauthorized access. By securely redacting sensitive information, organizations can protect against data breaches, maintain data integrity, and meet legal and compliance requirements.
Several .NET PDF components provide redaction support including:
For an in-depth analysis of features and price, visit our .NET PDF component comparison.
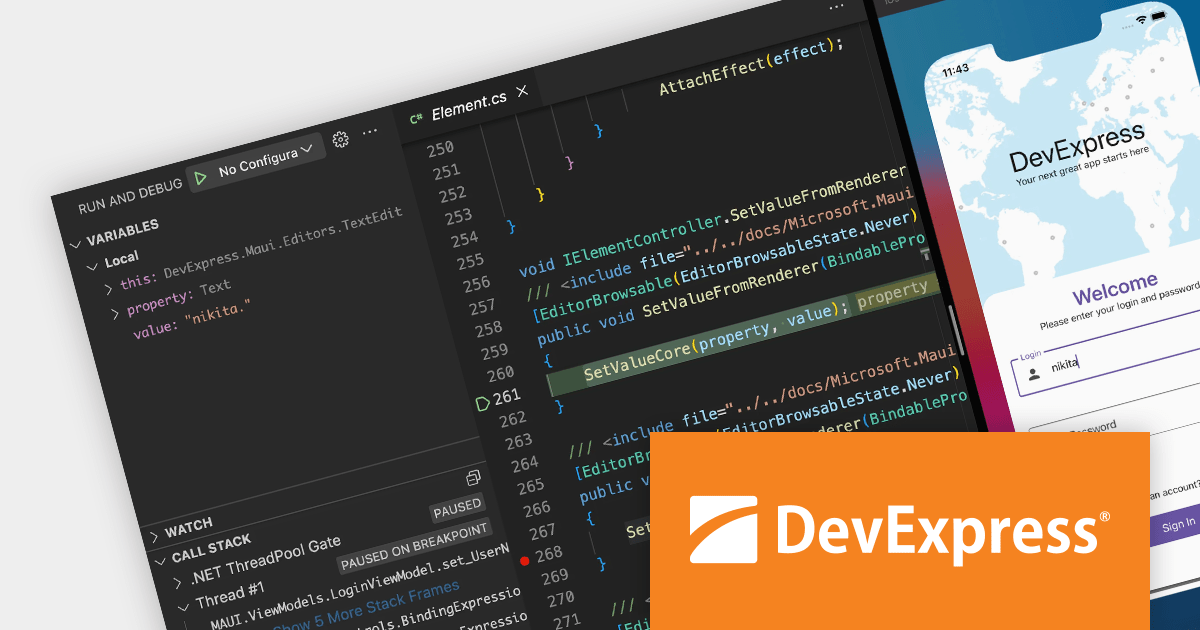
DevExpress .NET MAUI is a suite of high-quality, ready-to-use UI controls designed for building cross-platform mobile applications. It provides a comprehensive collection of UI elements, including data grid, data editors, charts, and many more, to help you create professional-looking and user-friendly mobile apps. The .NET MAUI components are written in Objective-C (iOS) and Java/Kotlin (Android) and integrate seamlessly with the .NET MAUI platform through the use of MAUI 'Handlers'.
In this blog post, DevExpress Paul Usher takes you through the process of how to build application for .NET MAUI on macOS, in light of the retirement of Visual Studio for Mac. Steps include:
Read the complete blog to get started building .NET MAUI applications on your Mac.
Get more information about the DevExpress .NET MAUI UI Component Library.
Technical support for DevExpress .NET MAUI is available as part of DevExpress Universal.
電話: (888) 850 9911
Fax: +1 770 250 6199


