


公式サプライヤー
公式および認定ディストリビューターとして200社以上の開発元から正規ライセンスを直接ご提供いたします。
当社のすべてのブランドをご覧ください。
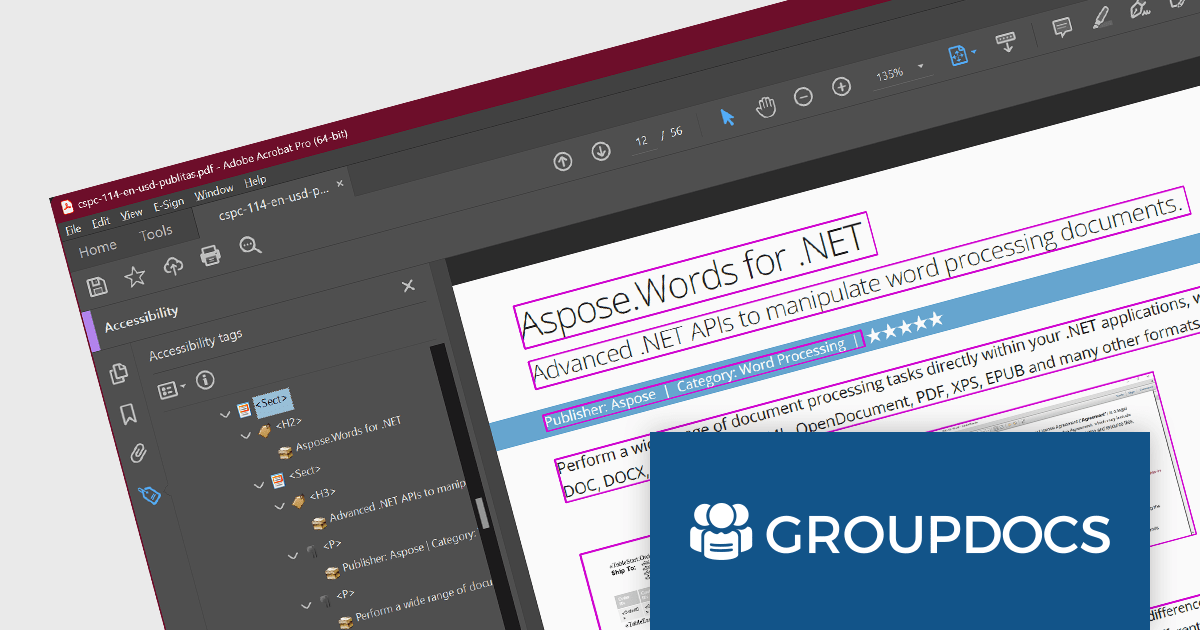
GroupDocs.Conversion for .NET is a powerful and versatile library designed to facilitate seamless document conversion within any .NET application. It empowers developers to effortlessly transform documents between various formats, including PDF, Microsoft Office documents (DOC, DOCX, XLS, XLSX, PPTX), HTML, eBook formats, and image types.
GroupDocs.Conversion for .NET V23.11 adds the ability to convert Tagged DOCX files to Tagged PDFs. This enhances accessibility and usability by preserving the semantic structure, maintaining the original formatting and layout, and ensuring compatibility with assistive technologies. This makes the document easier for users with or without disabilities to read, comprehend, and interact with the content, facilitating collaboration and ensuring equal access to information for all.
To see a full list of what's new in GroupDocs.Conversion for .NET V23.11, see our release notes.
GroupDocs.Conversion for .NET is licensed per developer and deployment location, and is offered as a Perpetual License with a 12 month support and maintenance subscription. It is available to buy in the following products:
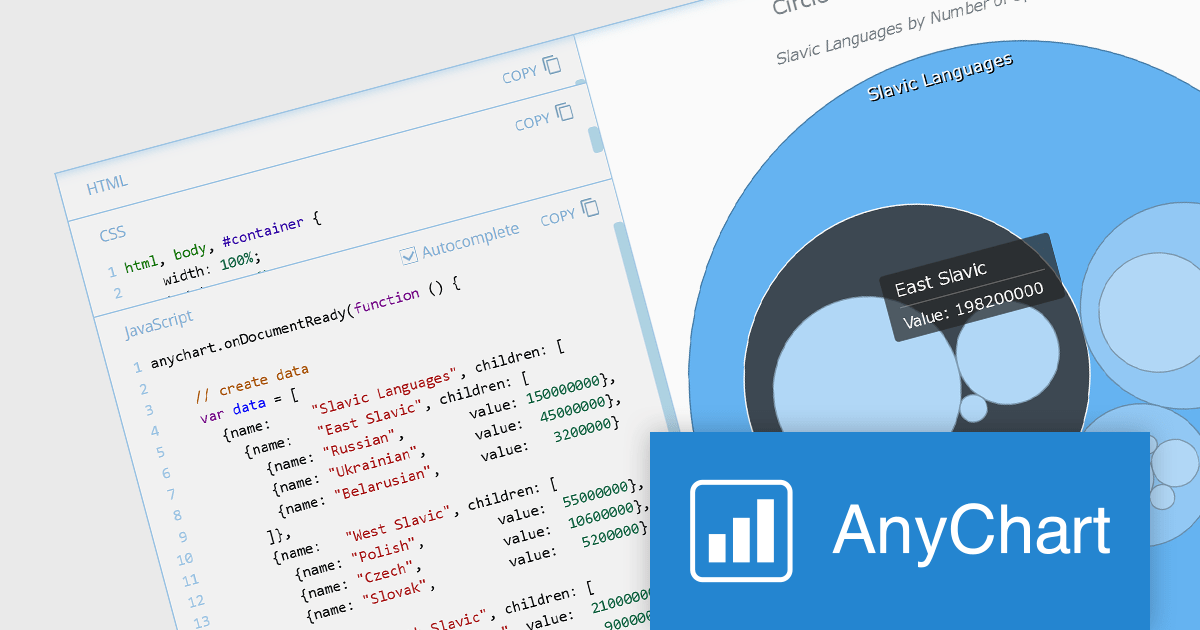
AnyChart JS is a lightweight and robust JavaScript charting library that enables you to create stunning and interactive charts, dashboards, and maps. It provides a wide range of chart types, including line charts, bar charts, pie charts, scatter plots, and more. You can also customize the appearance of your charts using a variety of options, such as colors, fonts, and themes.
The AnyChart JS 8.12 release adds a suite of interactivity events to the Circle Packing chart, allowing you to attach event listeners to any chart element and create dynamic visualizations that respond to user interactions such as mouse movements, hovers, and clicks. This new feature enables you to add or modify information and reshape chart behavior in real-time, enhancing data exploration experiences.
To see a full list of what's new in version 8.12.0, see our release notes.
AnyChart JS offers a range of Annual and Perpetual licensing options including Website, Internal, Saas, Enterprise, OEM, and Next Unicorn Licenses. For more information visit our AnyChart JS licensing page.
For more information, visit our AnyChart JS product page.
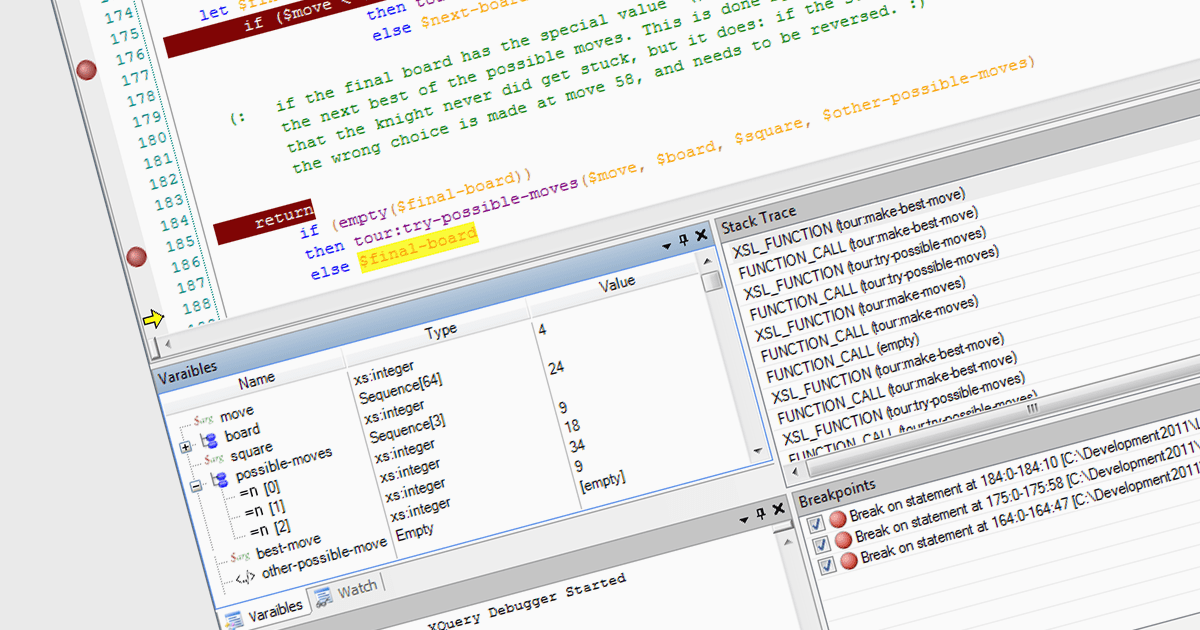
An XQuery Debugger assists developers in testing and debugging XQuery code, which is used to query XML data. This tool helps in stepping through code, setting breakpoints, and inspecting variables, which is vital for ensuring accurate data retrieval and manipulation in complex XML databases and documents.
Several Structured Document Tools allow you to debug XQuery including:
For an in-depth analysis of features and price, visit our Structured Document Tools comparison.
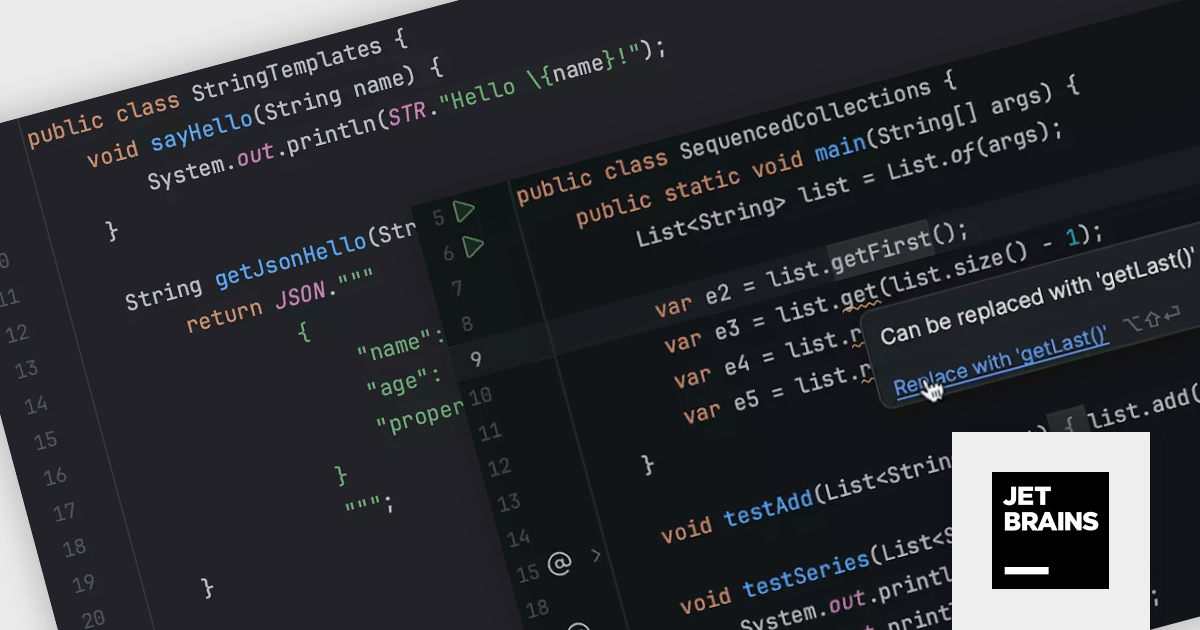
IntelliJ IDEA is a feature-rich Java IDE that empowers developers with a comprehensive set of tools for intelligent coding assistance, effortless navigation and search, seamless refactorings, in-depth code analysis, comprehensive Web and Enterprise development support, robust unit testing capabilities, and streamlined team collaboration features.
The IntelliJ IDEA 2023.3 release marks a significant milestone for Java development, offering support for the latest Java 21 advancements. Developers can now harness the power of virtual threads, record patterns, pattern matching for switch expressions, and sequenced collections, and explore previews of new language features including string templates and scoped values.
To see a full list of what's new in version 2023.3, see our release notes.
IntelliJ IDEA is licensed per user as a commercial annual subscription. We can supply New Subscriptions, Subscription Renewals, Lapsed Subscription Renewals, and Additional Developer Licenses. See our IntelliJ IDEA licensing page for full details.
For more information, visit our IntelliJ IDEA product page.
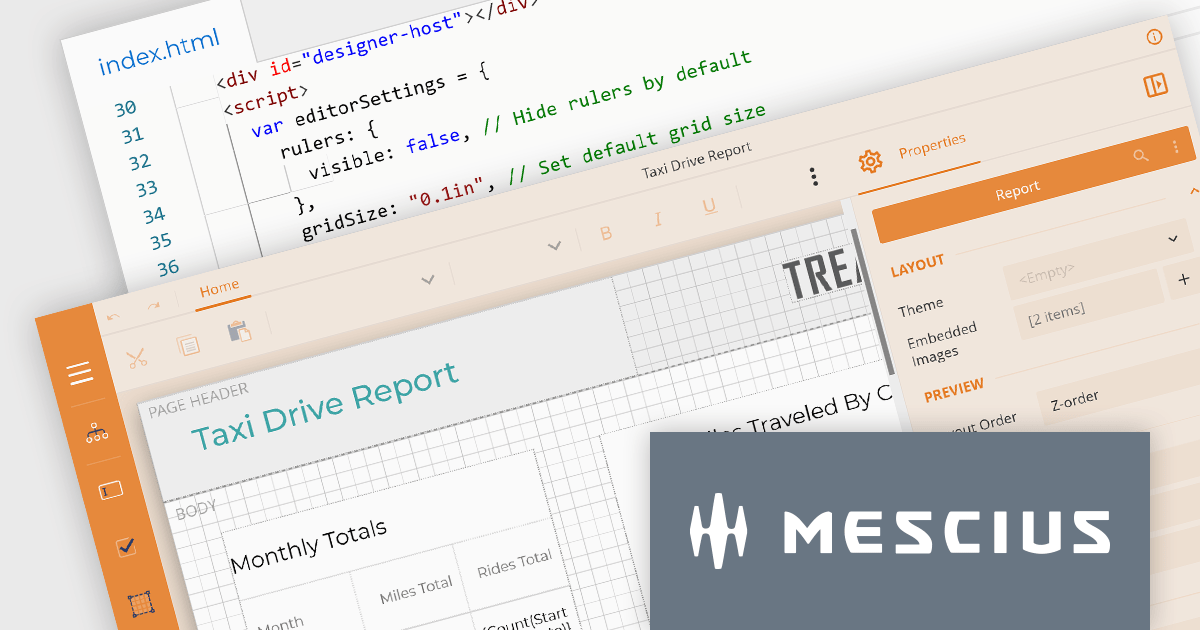
ActiveReportsJS by MESCIUS is a comprehensive JavaScript reporting solution that empowers developers to create interactive and dynamic reports within web applications. It offers a user-friendly design interface, a rich set of data visualization tools, and a flexible API, enabling the creation of reports that effectively present and analyze data for informed decision-making.
The ActiveReportsJS 4.2 release introduces a comprehensive customization API for the Report Designer which enables precise configuration of the user interface. This provides control over the visibility and layout of sidebar items, fine-tuning of menus and toolbars, and the ability to modify numerous UI elements to meet your users' needs.
To see a full list of what’s new in version 4.2, see our release notes.
ActiveReportsJS is licensed on an annual subscription or perpetual basis and is available as a Single Deployment License for non-commercial use, and as a Single Domain License or Unlimited Domain License for commercial and/or SaaS use. See our ActiveReportsJS licensing page for full details.
For more information, visit our ActiveReportsJS product page.
電話: (888) 850 9911
Fax: +1 770 250 6199


