













公式サプライヤー
公式および認定ディストリビューターとして200社以上の開発元から正規ライセンスを直接ご提供いたします。
当社のすべてのブランドをご覧ください。
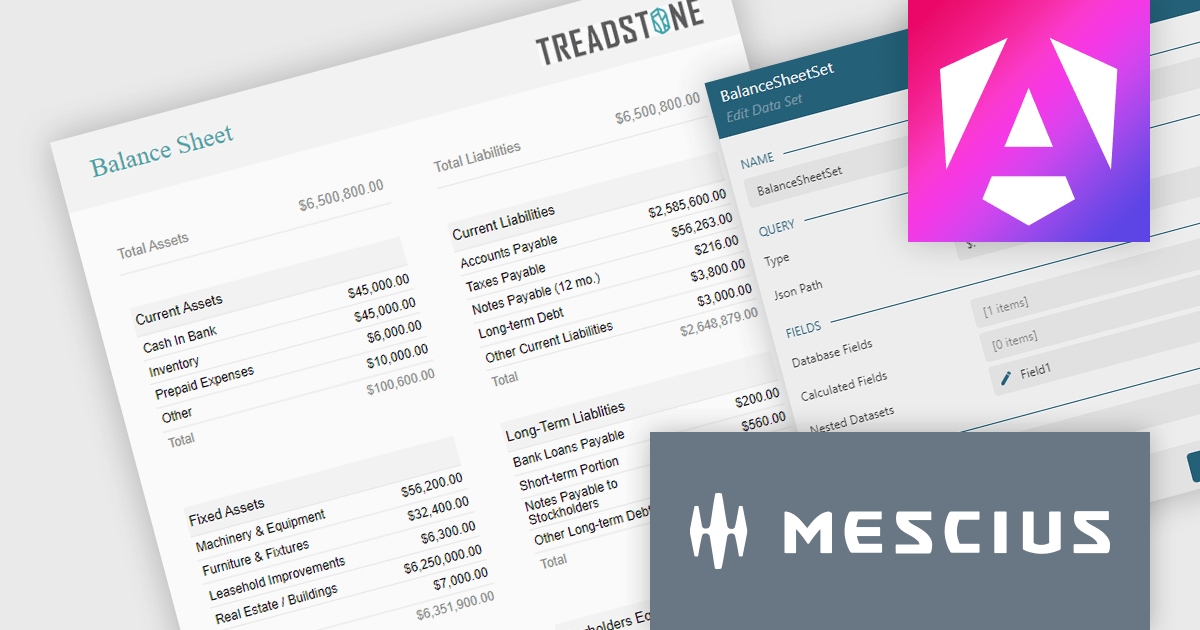
ActiveReportsJS is a powerful JavaScript reporting tool that allows developers and report authors to easily design and display reports within their web applications. With features such as drill-down, runtime data filtering, and interactive parameters, as well as compatibility with popular frameworks, ActiveReportsJS simplifies the process of creating and managing reports. Using the ActiveReportsJS Angular report designer component, many different types of data can be visualized, including financial reports (such as balance sheets) in a web application.
In this blog post, MESCIUS Technical Engagement Engineer Joel Parks shows you how to use the Angular Report Designer to design a balance sheet which can then be viewed in ActiveReportsJS's Angular Report Viewer. Steps include:
Read the full blog to get started using balance sheets to easily present a summary of a company's financial health and stability.
ActiveReportsJS is licensed on an annual subscription or perpetual basis and is available as a Single Deployment License for non-commercial use, and as a Single Domain License or Unlimited Domain License for commercial and/or SaaS use. See our ActiveReportsJS licensing page for full details.
For more information, visit our ActiveReportsJS product page.
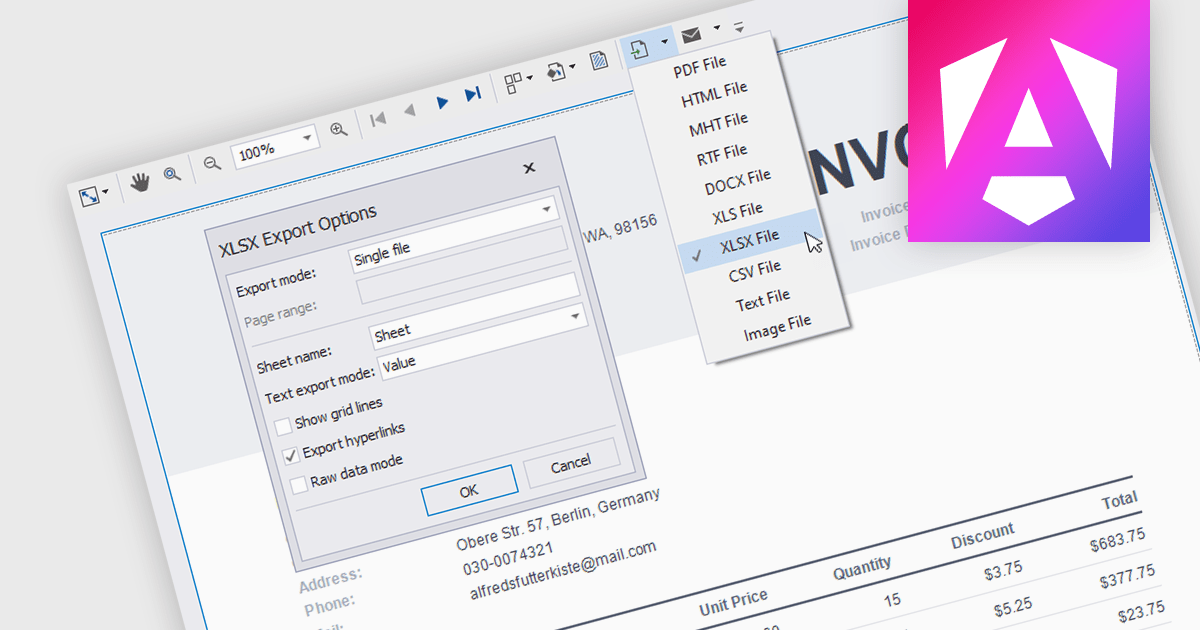
Reporting components with built-in XLS and XLSX export allow users to seamlessly generate Excel files directly from Angular web applications. This functionality empowers users to easily share and analyze report data in their preferred spreadsheet software, enhancing data accessibility and promoting informed decision-making. These components are particularly valuable for generating financial reports, sales data summaries, and other analytical exports.
Several Angular reporting components allow you to export reports to XLS or XLSX format:
For an in-depth analysis of features and price, visit our comparison of Angular reporting components.

Cross tabs, also known as crosstabulations or contingency tables, are a data visualization technique used in reporting to reveal relationships between two or more categorical variables. By organizing data in a grid with categories on rows and columns, Cross tabs allow users to quickly spot patterns that might not be obvious in standard report formats. This is particularly useful for tasks like understanding user demographics or segmenting customer behavior.
Several .NET WPF Reporting Controls offer cross tabs including:
For an in-depth analysis of features and price, visit our comparison of .NET WPF Reporting Controls.

FastReport Online Designer by FastReports is a web-based report designer tool that allows users to create, edit, and view reports directly in their browser on any device. This cross-platform designer integrates seamlessly with FastReport .NET, FastReport Core, and FastReport Open Source, making it a valuable tool for developers who want to empower their end users to customize report layouts and data visualization.
The FastReport Online Designer 2024.2 update introduces Custom SQL Query functionality, which significantly enhances the tool's versatility. It allows developers to write and execute tailored SQL queries directly within the report designer, enabling the integration of complex SQL views and custom data manipulations as standard tables in reports. This capability facilitates more precise data retrieval and manipulation, streamlining the reporting process by reducing the need for pre-processing data externally. Consequently, developers can now create more dynamic, data-rich reports that better meet specific business requirements, ultimately improving the efficiency and effectiveness of reporting solutions within their applications.
To see a full list of what's new in 2024.2, see our release notes.
FastReport Online Designer* is available in a number of license options: SCL may be used in a single application within one organization. SaaS allows embedding within a Cloud platform for your SaaS subscribers. OEM can be integrated into a distributed solution to your customers. Unlimited is also available for custom distributions. See our FastReport Online Designer licensing page for full details.
Learn more on our FastReport Online Designer product page.
* FastReport Online Designer requires FastReport.NET, FastReport Core or FastReport Open Source to work.

Barcodes are embedded machine-readable symbols that encode data points directly within reports. This allows developers to streamline data tracking and integration with external systems by providing a scannable representation of key information alongside the human-readable report. Scanning barcodes enables quick and easy data capture instead of error prone manual data entry. Embedded barcodes allow for effortless item identification and tracking throughout processes like supply chain management or inventory control. Users can instantly access detailed information associated with the encoded data, streamlining information retrieval.
Several .NET Reporting controls include Barcodes including:
For an in-depth analysis of features and price, visit our comparison of .NET Reporting Controls.
電話: (888) 850 9911
Fax: +1 770 250 6199


