


公式サプライヤー
公式および認定ディストリビューターとして200社以上の開発元から正規ライセンスを直接ご提供いたします。
当社のすべてのブランドをご覧ください。
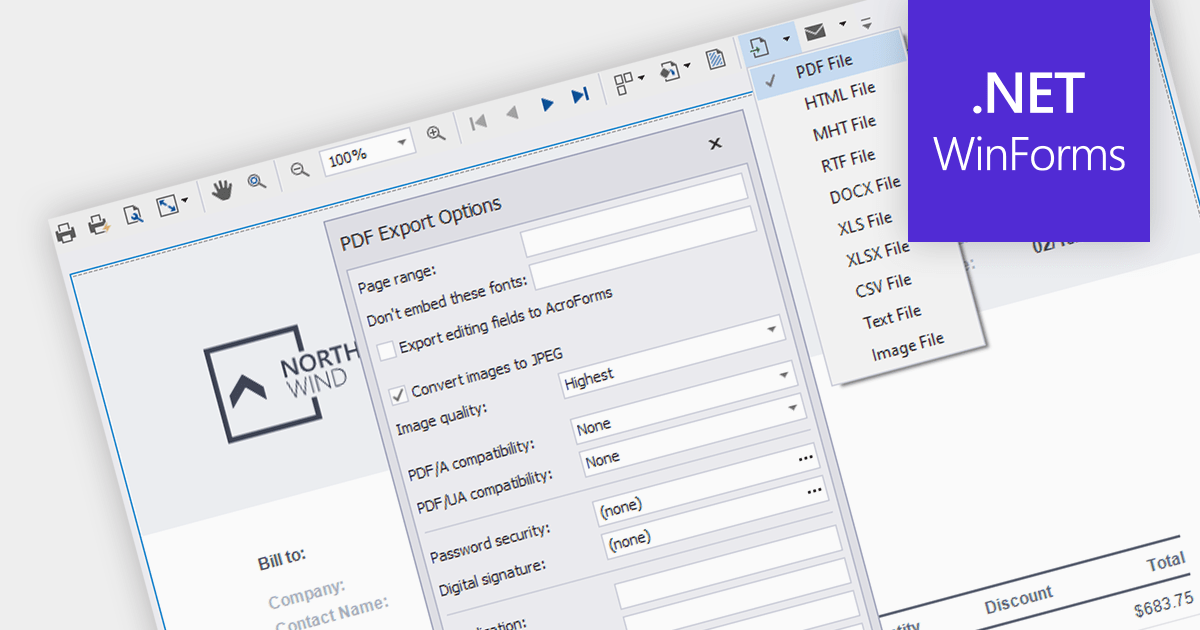
PDF export functionality in a reporting component allows users can effortlessly convert reports into PDF format, preserving the original layout and facilitating seamless sharing and printing. The widespread adoption and cross-platform compatibility of PDF make it an indispensable choice for distributing reports effectively.
Several WinForms reporting components support PDF export including:
For an in-depth analysis of features and price, visit our comparison of WinForms Reporting components.
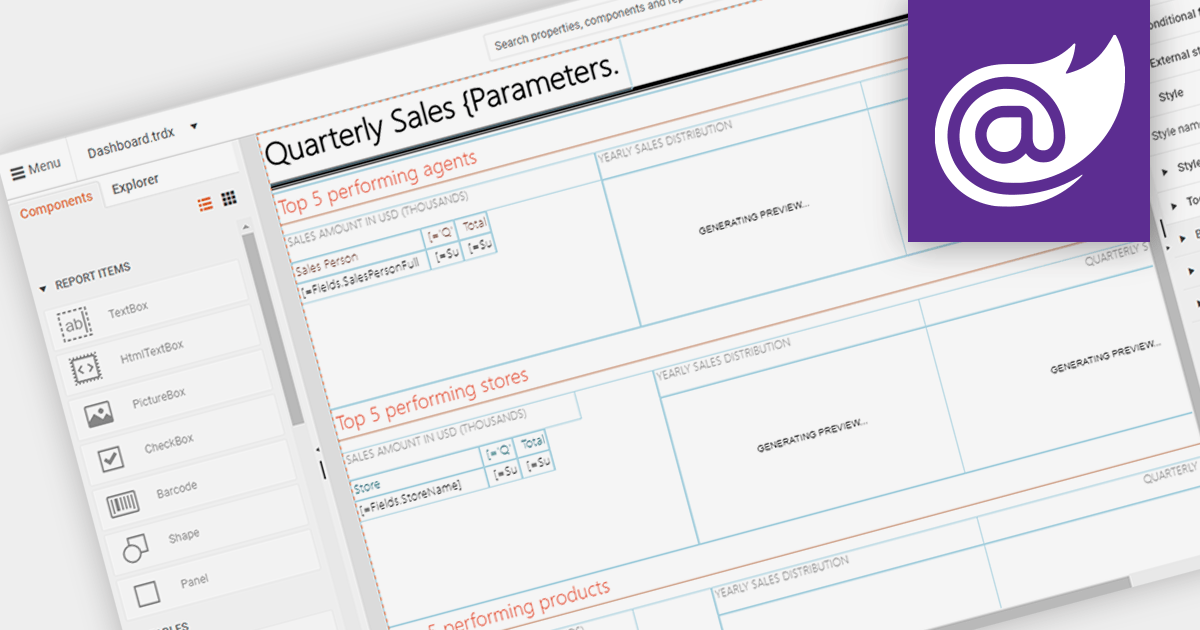
An end user report designer allows non-technical users to create and modify reports directly within an application. This tool often provides a drag-and-drop interface, enabling users to design custom report layouts, define data sources, and set up data bindings without needing to write code. It empowers users to generate personalized reports based on their specific needs and preferences, enhancing the flexibility and usability of the reporting software.
Several Blazor reporting components provide an end user report designer including:
For an in-depth analysis of features and price, visit our comparison of Blazor Reporting components.
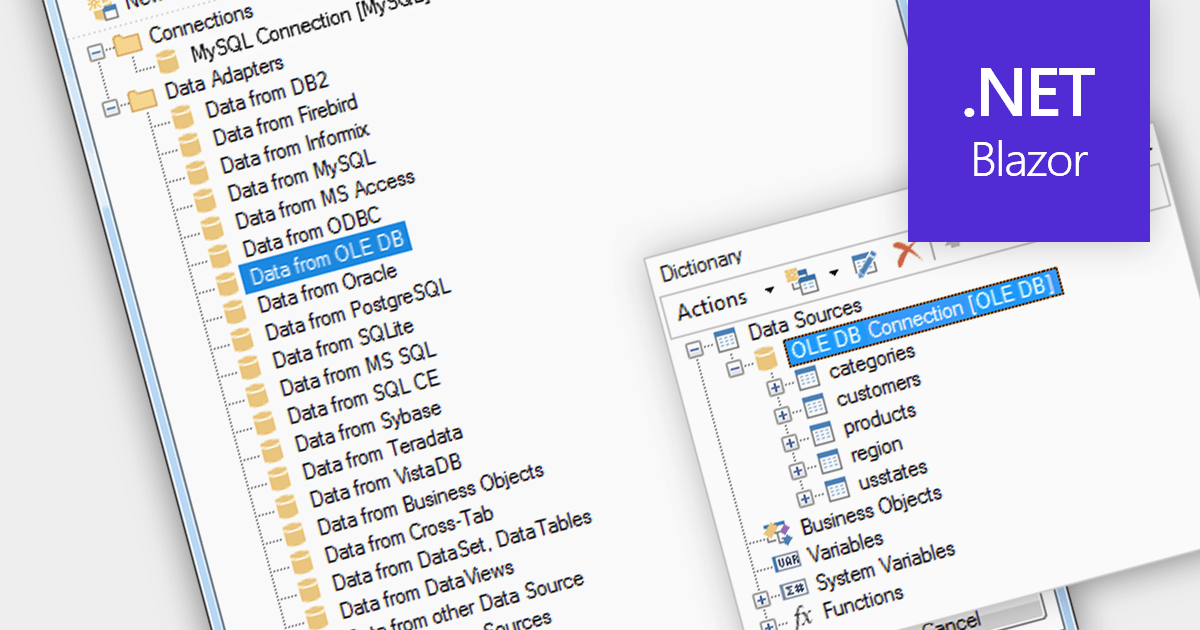
OLEDB data connectivity allows reporting software to connect to various databases and data sources through the Object Linking and Embedding Database (OLEDB) framework. This provides a wide range of data access capabilities within reports, essential for extracting data from relational databases, spreadsheets, and other OLEDB-compatible sources.
Multiple Blazor reporting components are compatible with OLEDB, including:
For an in-depth analysis of features and price, visit our comparison of Blazor reporting components.
DevExpress Reporting is a powerful and flexible reporting solution for .NET developers. It allows you to create reports of any complexity, from simple data tables to complex dashboards and interactive visualizations. DevExpress Reporting supports a wide range of data sources, including SQL databases, Entity Framework, and custom objects. It also offers a variety of export options, including PDF, XLSX, HTML, and RTF.
DevExpress Reporting is also available as part DevExpress DXperience and DevExpress Universal, a suite of over 600 UI controls and libraries for building high-impact business solutions for Windows Forms, WPF, ASP.NET, Blazor and more.
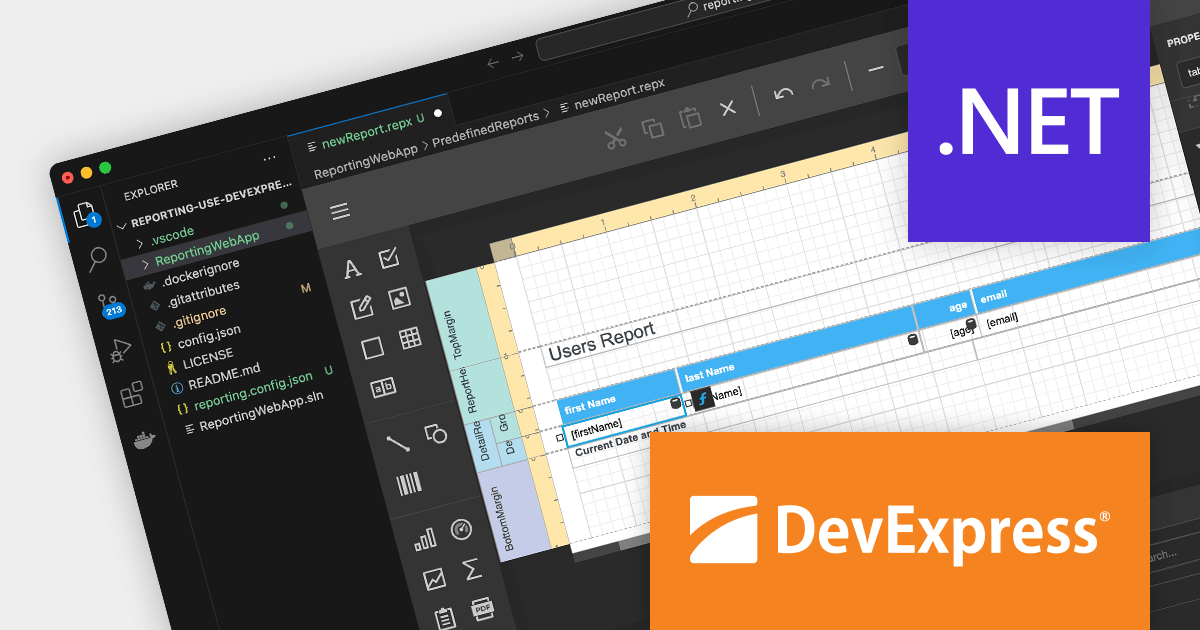
Create and Modify DevExpress Reports in Visual Studio Code (VS Code) on macOS and Linux (CTP).
The DevExpress Visual Studio Code Report Designer Extension allows you to create and edit DevExpress Report documents within the Visual Studio Code IDE.
A recent blog post by the DevExpress Reporting Team guides you through the setup process on macOS and illustrates how you can leverage the extension's capabilities to develop and modify existing reports.
Read the full blog now to learn more about this powerful capability.

combit Report Server is a versatile BI reporting solution which can be used standalone or integrated into your List & Label application. It can be customized to match your corporate design and enables platform-agnostic report generation, scheduling, and exporting from a variety of data sources in multiple formats and languages.
Version 29 of Report Server brings a new fully browser-based web designer, allowing your customers to design reports directly in the browser, independent of any platform. As a result they no longer need to install any software locally on their client, making Report Server more accessible, improving the collaboration experience, and reducing the cost and effort of maintaining software on each user's machine.
To see a full list of what’s new in version 29, see our release notes.
Report Server is available to buy in the following products:
電話: (888) 850 9911
Fax: +1 770 250 6199


