


公式サプライヤー
公式および認定ディストリビューターとして200社以上の開発元から正規ライセンスを直接ご提供いたします。
当社のすべてのブランドをご覧ください。
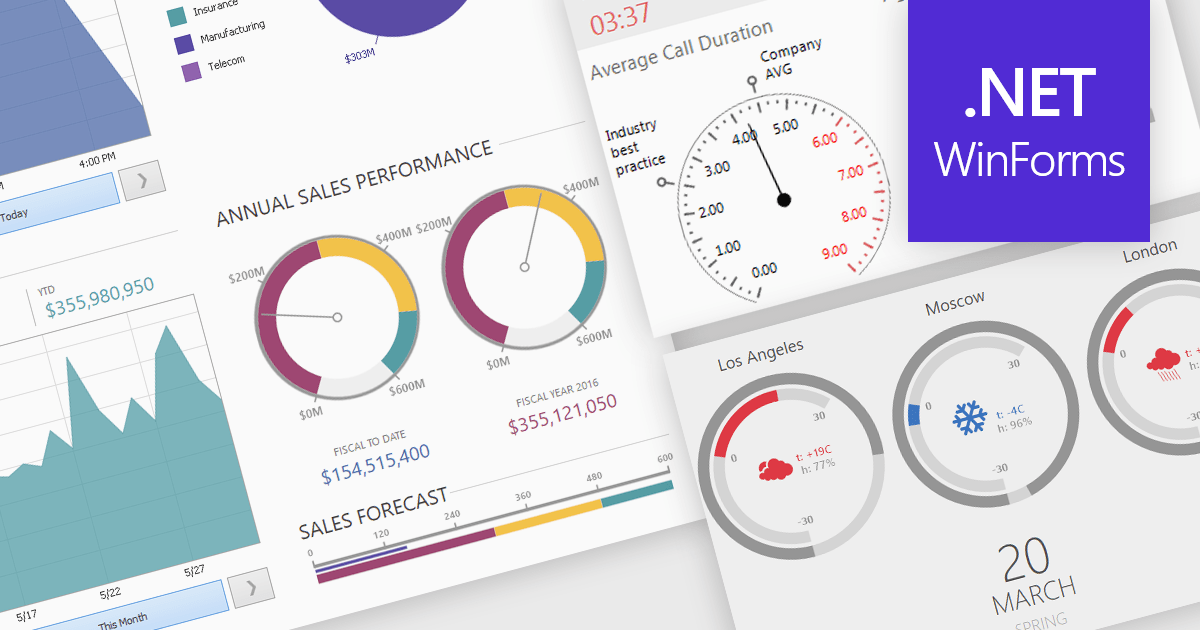
A gauge is a visual reporting element, such as a dial, meter, or progress bar, designed to display a single metric’s value in relation to defined targets or thresholds. For software developers, gauges offer a quick and intuitive way to present key performance indicators, making it immediately clear whether performance is on track, exceeding expectations, or requires attention. By transforming raw data into a simple, at-a-glance visual, gauges reduce the need for users to analyze complex tables or charts, improve the readability of dashboards and reports, and support faster, more informed decision-making.
Several .NET Winforms Reporting controls include Gauges including:
For an in-depth analysis of features and price, visit our comparison of .NET Winforms Reporting Controls.
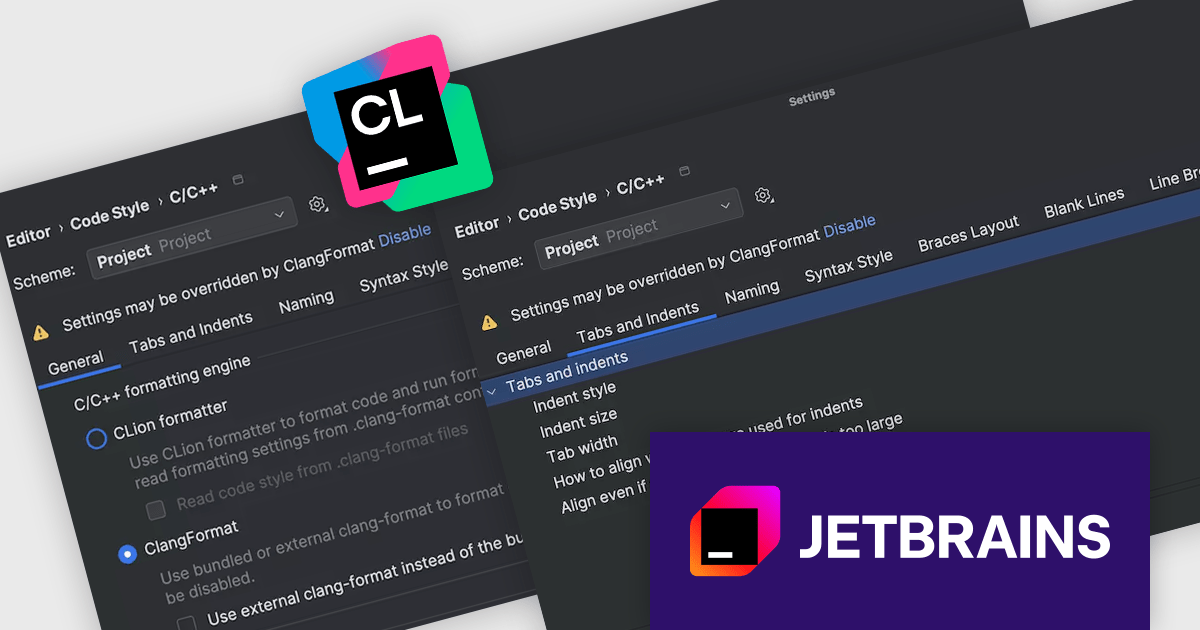
CLion, by JetBrains, is a robust Integrated Development Environment (IDE) tailored for C and C++ development, with support for other languages like Python, Kotlin, and Rust via plugins. Designed for software developers and embedded engineers, it streamlines coding with features like intelligent code completion, real-time analysis, and an advanced debugger. CLion integrates seamlessly with tools like CMake, version control systems, and remote development setups, making it ideal for cross-platform and performance-critical projects. By automating repetitive tasks and enhancing code quality, it helps developers focus on innovation and problem-solving.
The JetBrains CLion 2025.2 update improves the handling of code formatting for C and C++ projects by making it more consistent and easier to manage. The behavior of indentation in the editor, information shown in the status bar, and formatter settings are now better aligned, so developers can more clearly see how formatting rules are applied. A new status bar widget also offers quick access to other formatting tools, helping reduce the need to switch between settings. These changes aim to make it simpler to maintain a consistent code style across different parts of a project.
To see a full list of what's new in version 2025.2, see our release notes.
CLion is licensed per user as a commercial annual subscription. We can supply New Subscriptions, Subscription Renewals, Lapsed Subscription Renewals, and Additional Developer Licenses. See our CLion licensing page for full details.
CLion is available to buy individually or as part of JetBrains All Products Pack.
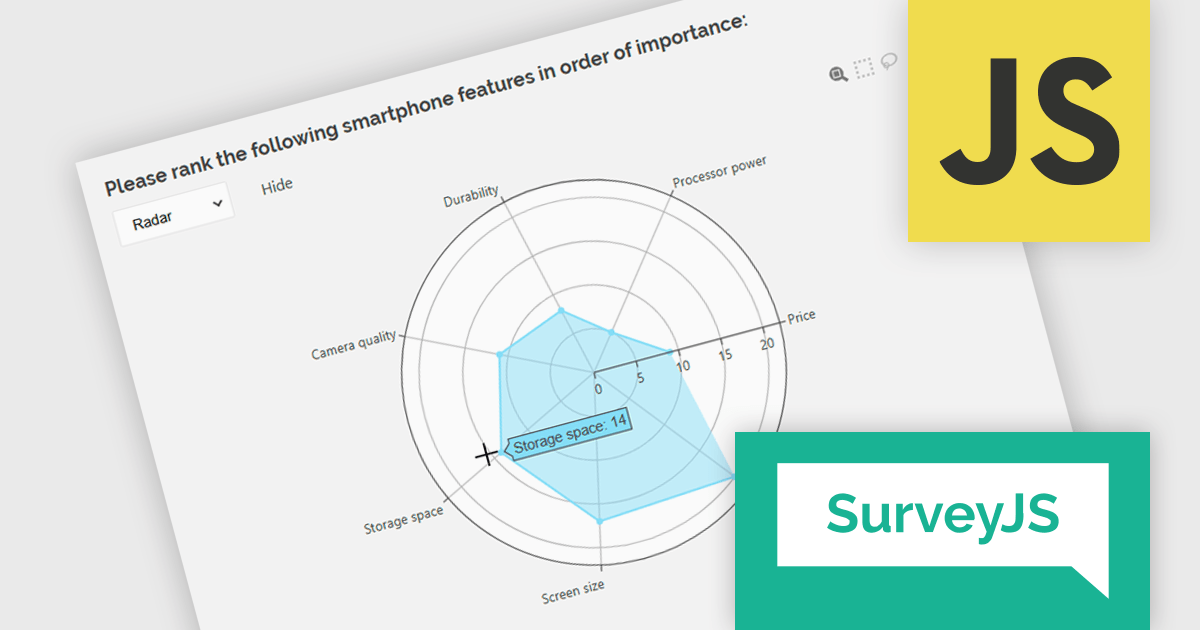
SurveyJS Dashboard is a JavaScript UI component that visualizes survey responses in real time using interactive charts and tables, helping teams analyze data quickly and efficiently. It integrates with any JavaScript framework, including Angular, React, Vue, and vanilla JS. The dashboard renders data based on JSON schemas created in Survey Creator and filled with responses from the Form Library. Its flexible, backend-independent design allows integration with any custom backend. With a variety of chart types, it supports use cases such as customer feedback, employee surveys, and market research by turning raw data into clear visual insights.
The SurveyJS Dashboard v2.3.0 update introduces support for radar charts, which developers can use to represent rank-based responses more intuitively, helping users gain clearer insights into survey data without additional configuration. This new chart type is automatically available for Ranking questions and can be selected directly from the chart type menu within the Dashboard.
To see a full list of what's new in version 2.3.0, see our release notes.
SurveyJS Dashboard is licensed per developer with a one-time payment for indefinite use. Access to updates and technical support is available through a subscription. See our SurveyJS Dashboard licensing page for full details.
Learn more on our SurveyJS Dashboard product page.
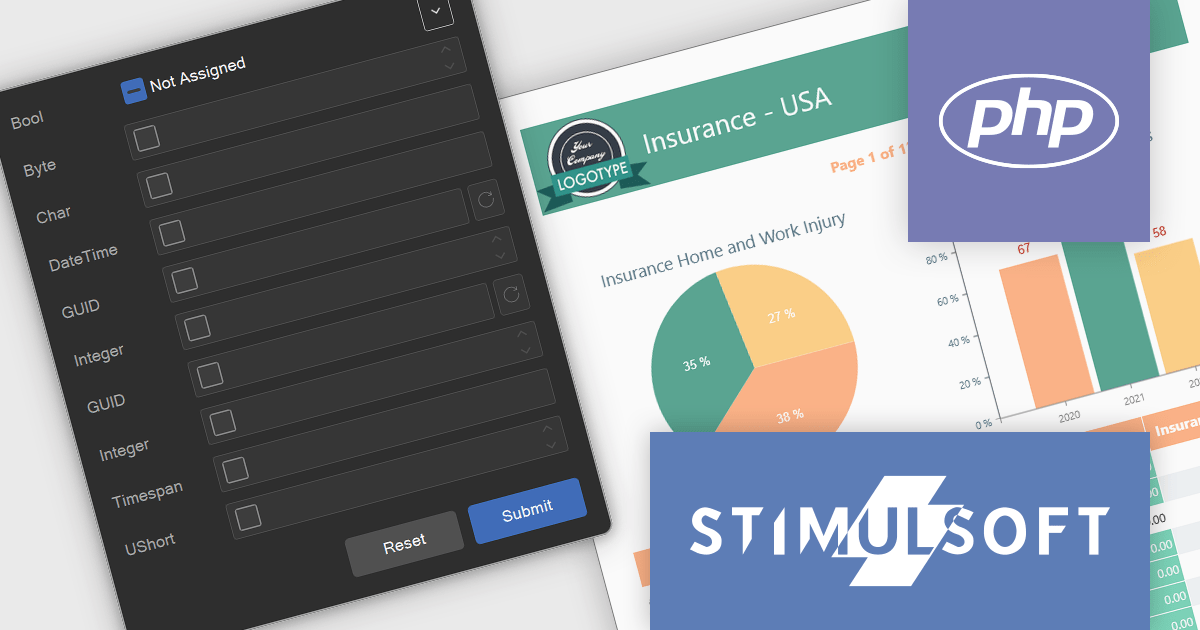
Stimulsoft Reports.PHP is a reporting tool designed to be embedded within PHP applications. It offers a client-server architecture for generating, viewing, printing, and exporting reports online. The solution includes a JavaScript report engine for fast execution, a native JavaScript report designer for building reports with various data sources and visualizations, and a PHP server-side component for data processing. This integration allows developers to seamlessly add robust reporting functionality to their PHP applications.
The latest Stimulsoft Reports.PHP update introduces support for nullable variable states through a new 'Not Assigned' option in the Parameters Panel, allowing developers to define variables without preset values. This enhancement improves alignment with backend data models by accurately representing null or optional inputs, and enables more dynamic report logic by supporting conditional behavior based on whether a variable is assigned. It simplifies parameter management in complex reporting scenarios and enhances user experience by offering greater control over input flexibility.
Stimulsoft Reports.PHP is licensed per developer and is available as a Perpetual license with 1 year support and maintenance. See our Stimulsoft Reports.PHP licensing page for full details.
Stimulsoft Reports.PHP is available in the following products:

Cell-level editing and interaction features are essential components of any modern spreadsheet application, as they directly influence how users enter, modify, and manage data at the most granular level. These capabilities go beyond basic typing to provide enhanced flexibility, control, and context, enabling users to maintain accuracy while streamlining workflows. A well-designed set of cell-level tools supports both data integrity and user productivity, ensuring that spreadsheets can handle everything from quick updates to complex, structured datasets with efficiency and precision.
Common features include:
For an in-depth analysis of features and price, visit our Angular spreadsheet components comparison.
電話: (888) 850 9911
Fax: +1 770 250 6199


