


公式サプライヤー
公式および認定ディストリビューターとして200社以上の開発元から正規ライセンスを直接ご提供いたします。
当社のすべてのブランドをご覧ください。
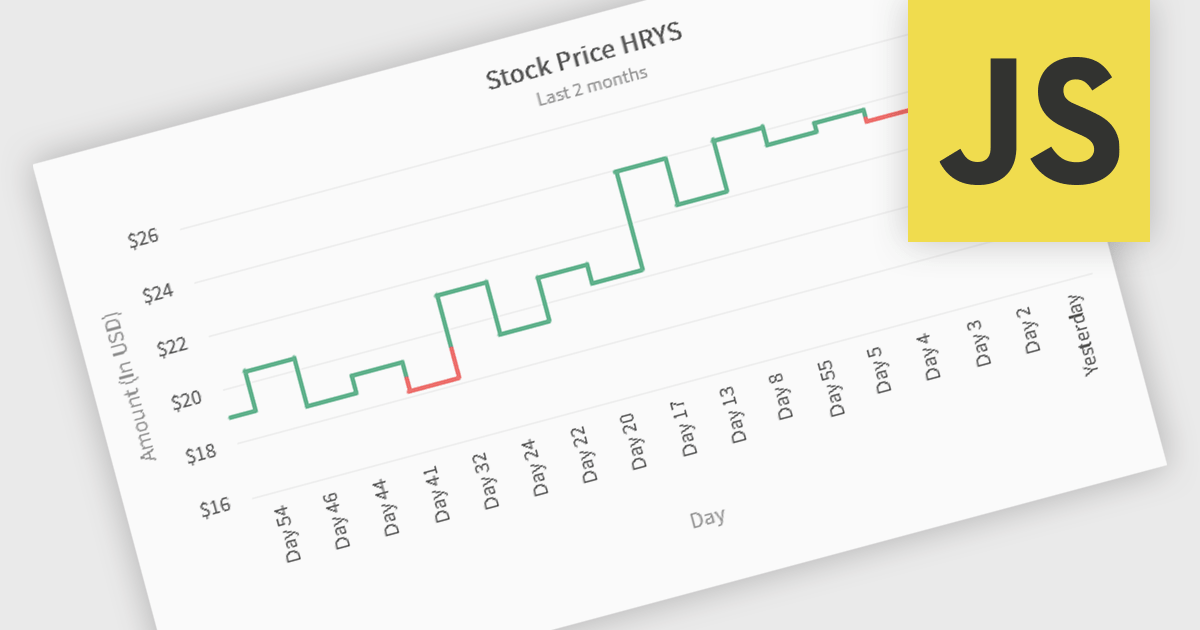
Kagi charts are a technical analysis tool that display price movement through vertical lines, ignoring time to focus on significant price changes. Thick lines indicate rising demand when prices break above previous highs, while thin lines signal increased supply when prices fall below previous lows. This clear visual format helps traders filter out noise, identify trends, and spot key breakouts or reversals. Ideal for analyzing market sentiment, Kagi charts are used across stocks, forex, and commodities to support confident, data-driven trading decisions.
Several JavaScript chart components provide Kagi charts, including:
For an in-depth analysis of features and price, visit our JavaScript charts comparison.
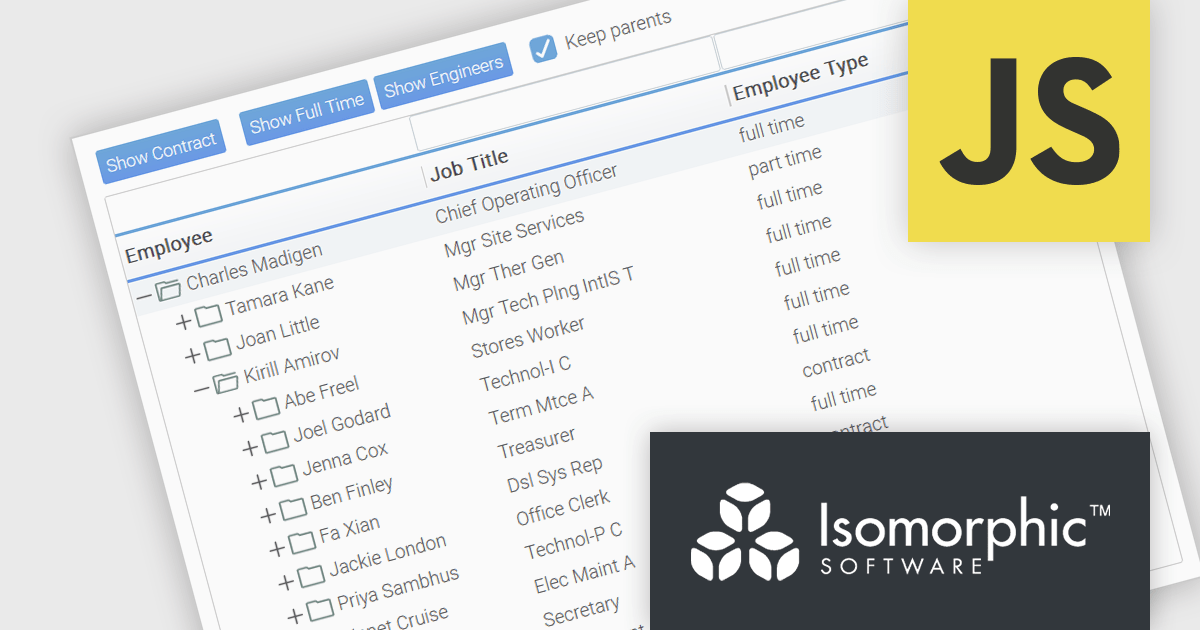
SmartClient is a powerful JavaScript component suite compatible with React, Vue, Angular, and more, designed for building large-scale, high-performance web apps. It offers advanced UI components, dynamic data handling, customizable grids, and responsive design. Ideal for enterprise use cases like financial analytics and real-time reporting, SmartClient supports seamless backend integration and delivers optimized performance and scalability.
SmartClient has enhanced hierarchical data handling with the included KeepParentsOnFilter setting, ensuring that parent nodes remain visible in filtered views, even when data is loaded dynamically. It loads "skeleton branches" via a complex client-driven algorithm, automatically managed by SmartClient, to maintain high performance without preloading the entire tree, meaning it doesn't require server-side programming. This is particularly useful in large datasets with load-on-demand trees, as it allows users to maintain full visibility into the structure of filtered results without losing context. By preserving the hierarchical path to matching records, this feature improves usability and clarity in tree-based components, especially in applications where understanding the parent-child relationship is critical.
SmartClient is licensed per developer and is available as both perpetual and subscription licenses. Product updates and technical support is also available. See our SmartClient licensing page for full details.
For more information, visit our SmartClient product page.

両社は2005年以来、良好なパートナーシップを築き、高品質なソフトウェアモデリングおよび可視化ツールを世界中の開発者にお届けしています。この協業は、「直感的かつ視覚的なコミュニケーションを通じてソフトウェア設計プロセスを向上させる」という共通の理念に基づいています。使いやすさ、明確性、コラボレーションを重視したChange Visionのツールは、開発ライフサイクル全体を通じてチームの認識を統一し、複雑なシステムを効果的にモデリングすることを可能にします。
Change Visionの製品群は、さまざまなユーザーのニーズや利用環境に対応したUML・モデリングツールを幅広く取り揃えています。主力製品の astah* professionalでは、UML、ER図、DFD、マインドマップなどを作成でき、ソフトウェアアーキテクト、ビジネスアナリスト、開発者に対して、計画や情報共有のための統合環境を提供します。また、astah* UML, astah* SysML, astah* System Safety, astah* think!,などの補完的なツールにより、モバイルやコラボレーションを含む多様なワークフローに対応しつつ、モデルの正確性を損なうことなく軽量で専門的な体験を実現します。
ComponentSourceは、Change Visionとの提携を通じて、これら高度なモデリングツールを世界中のお客様にお届けしています。現地に即したサポートや円滑な購入手段を提供することで、ComponentSourceの製品ラインアップにおいて他社との差別化を図り、明確かつ効率的なソフトウェア開発を支援する信頼性の高いブランドを展開しています。両社は協力して、開発者がより優れたソフトウェアを迅速に構築するために必要な可視化ツールを提供し続けています。
astah*製品では、個人および法人向けにさまざまなライセンスオプションをご用意しています。永続ライセンスは初年度のサポートおよびアップグレードを含む永久利用権を提供します。年間ライセンスは1年間の利用権とサポートを提供し、個人、小規模チーム、大規模組織(フローティング又はノードカウントライセンス)向けにご利用いただけます。教育機関向けには、アカデミックライセンス以外に学生個人または教職員全体を対象としたフローティングライセンスをご用意しています。詳細は、弊社の astah* professionalのライセンス ;をご覧ください。
詳細については、弊社の Change Visionブランドページ をご覧ください。
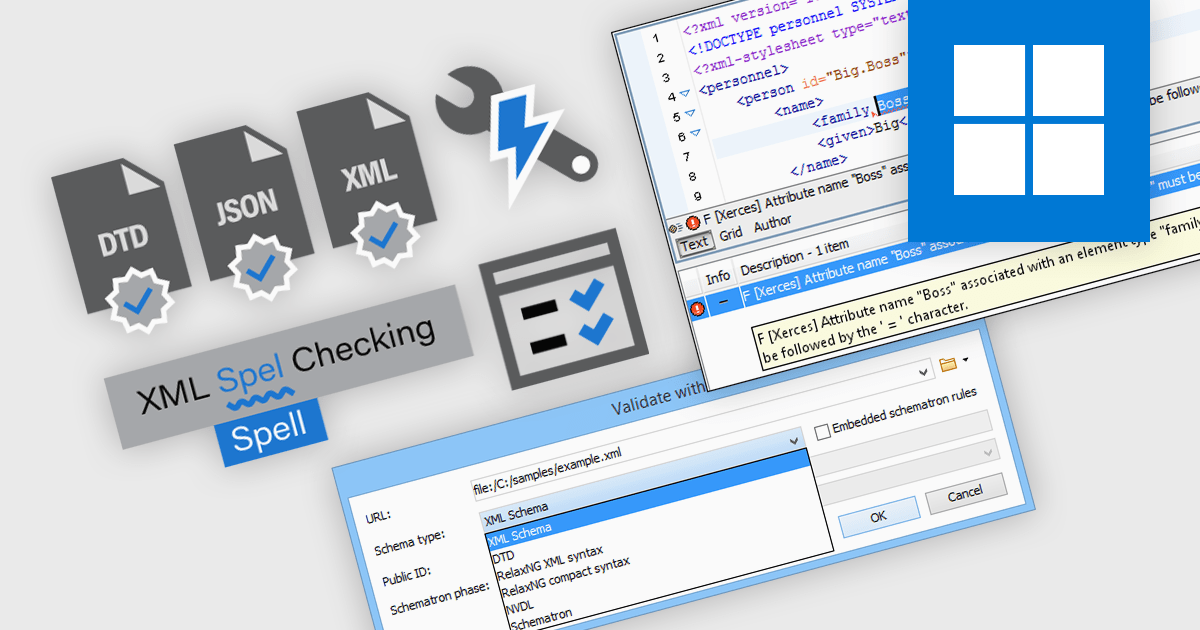
Validation and checking features in structured document tools are designed to ensure the integrity, correctness, and compliance of documents written in formats like XML and JSON. These tools assist developers and content authors throughout the editing process, detecting syntax errors, enforcing structural rules, and maintaining standards conformance. By integrating automated validation, intelligent correction suggestions, and format-specific diagnostics, these features reduce manual debugging effort and enhance the reliability of structured content in technical and data-driven applications.
Common features include:
For an in-depth analysis of features and price, visit our structured document tools comparison.
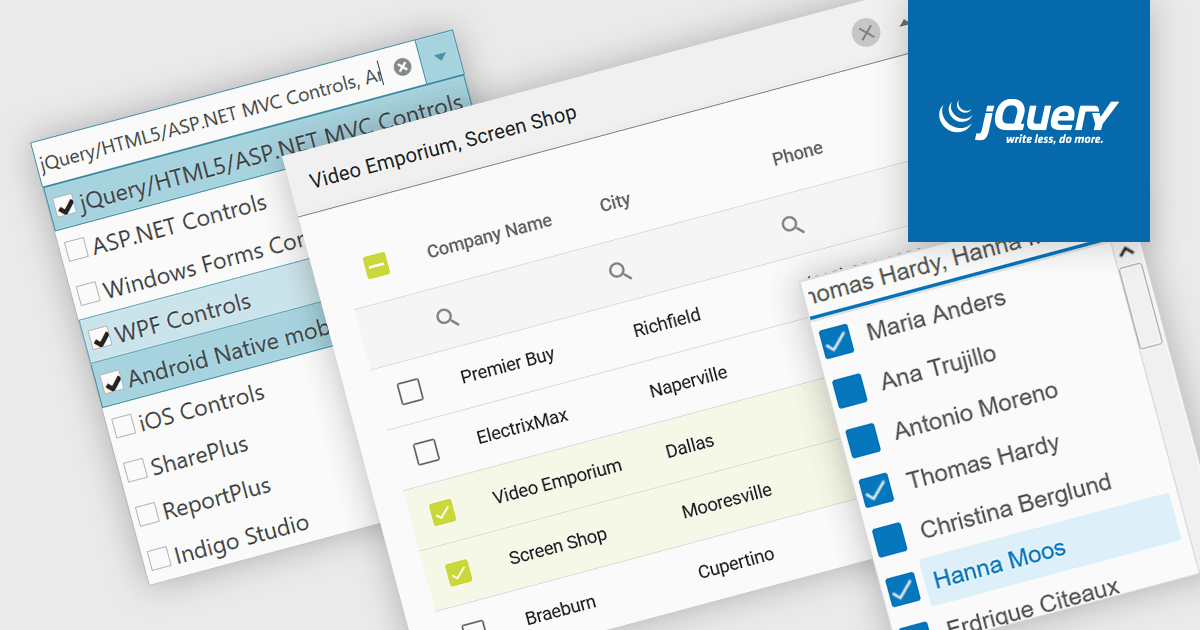
A checked combobox is a data editor component used in user interfaces that consists of a text box with a drop-down panel. This panel displays a predefined list of items, in a clean and organized layout, from which users can input data by making a singular or multiple selections using the adjacent checkboxes. The values are then typically displayed as a comma-separated summary in the collapsed field. This type of control provides developers with a convenient way to implement multi-select functionality within their applications, and is especially effective in scenarios such as filtering datasets or configuring settings, without consuming additional space on the interface.
Several jQuery data editor collections include checked comboboxes, including:
For an in-depth analysis of features and price, visit our comparison of jQuery data editors.
電話: (888) 850 9911
Fax: +1 770 250 6199


