


公式サプライヤー
公式および認定ディストリビューターとして200社以上の開発元から正規ライセンスを直接ご提供いたします。
当社のすべてのブランドをご覧ください。
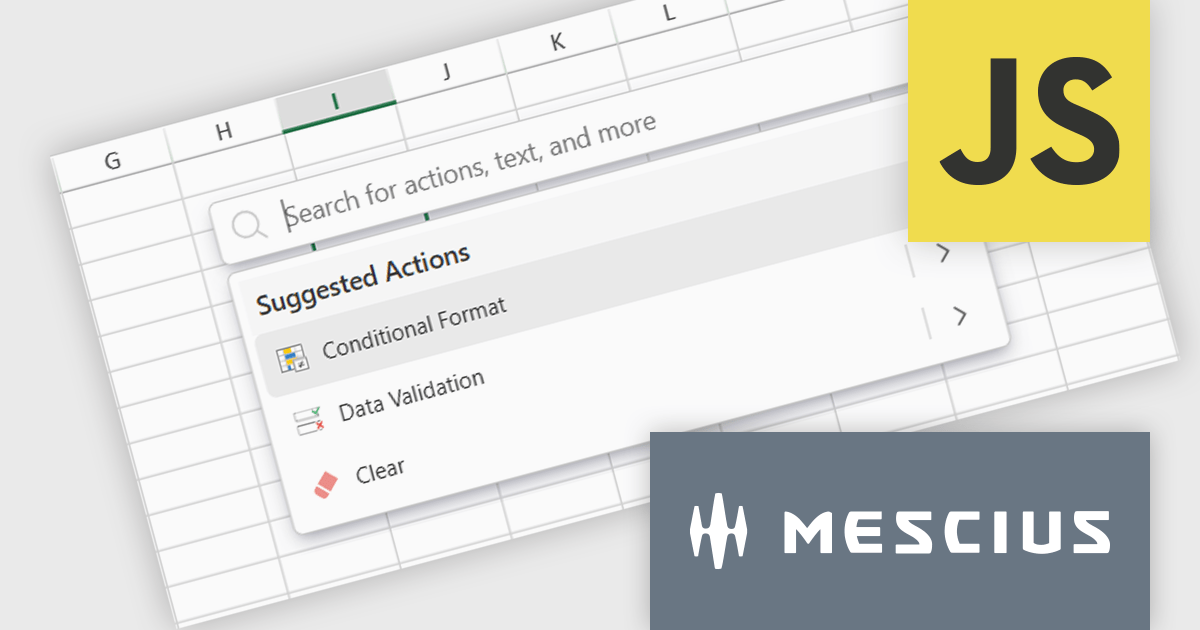
SpreadJS is a high-performance JavaScript spreadsheet and data presentation component designed for enterprise web applications. It enables developers to deliver Excel-like functionality directly within their web solutions, providing advanced features such as data binding, complex calculations, pivot tables, charts, and extensive formatting options. Fully compatible with modern JavaScript frameworks like React, Angular, and Vue, SpreadJS allows seamless integration and customization, empowering development teams to create interactive, data-driven user experiences without relying on external spreadsheet applications.
The SpreadJS 18.1.0 update introduces the new Command Palette, providing developers with a centralized interface to quickly access and execute a wide range of spreadsheet commands without navigating through complex menus. This enhancement improves productivity by reducing the time required to locate functions, allowing developers to apply formatting, manage data, and configure worksheet settings directly through intuitive search and selection capabilities. The Command Palette can be instantly triggered using the familiar Ctrl/Cmd + P keyboard shortcuts, offering quick access to commands and further accelerating common development and data manipulation tasks within the application.
To see a full list of what's new in 18.1.0, see our release notes.
SpreadJS is licensed per developer and includes 1 Year Maintenance (major and minor version releases and unlimited support phone calls). SpreadJS requires an Annual or Perpetual Deployment License. The optional Add-ons are available at an additional cost, and require a SpreadJS license. See our SpreadJS licensing page for full details.
For more information, visit our SpreadJS product page.
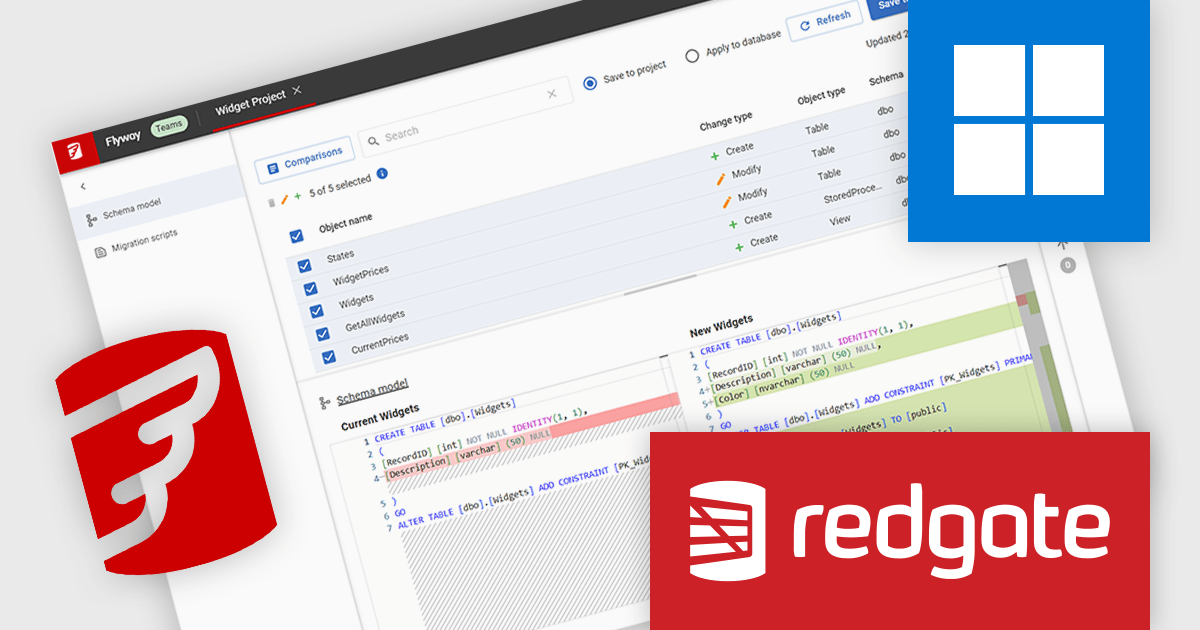
Flyway extends DevOps practices to databases, significantly speeding up how quickly software can be released and improving the overall quality of the code. By offering features like version control for database schemas and enabling continuous delivery pipelines for database changes, Flyway empowers individuals, teams, and organizations to enhance their existing software delivery workflows through the automation of database development tasks. This integration ensures that database changes are managed with the same rigor and efficiency as application code, leading to faster, more reliable, and less error-prone software deployments.
Redgate Flyway simplifies disaster recovery for software developers by providing advanced object-level database versioning, enabling the effortless restoration of database schemas to any previously committed state. This feature mitigates the impact of unintended changes or deployment errors by allowing rapid reversion to a known good configuration across supported database systems like SQL Server, Oracle, PostgreSQL, and MySQL. Consequently, developers can confidently implement database modifications, knowing that a reliable mechanism exists to quickly recover and minimize downtime, thereby enhancing the stability of their applications.
Flyway is licensed per server on an annual subscription basis. See our Flyway licensing page for full details.
For more information, visit our Redgate Flyway product page.
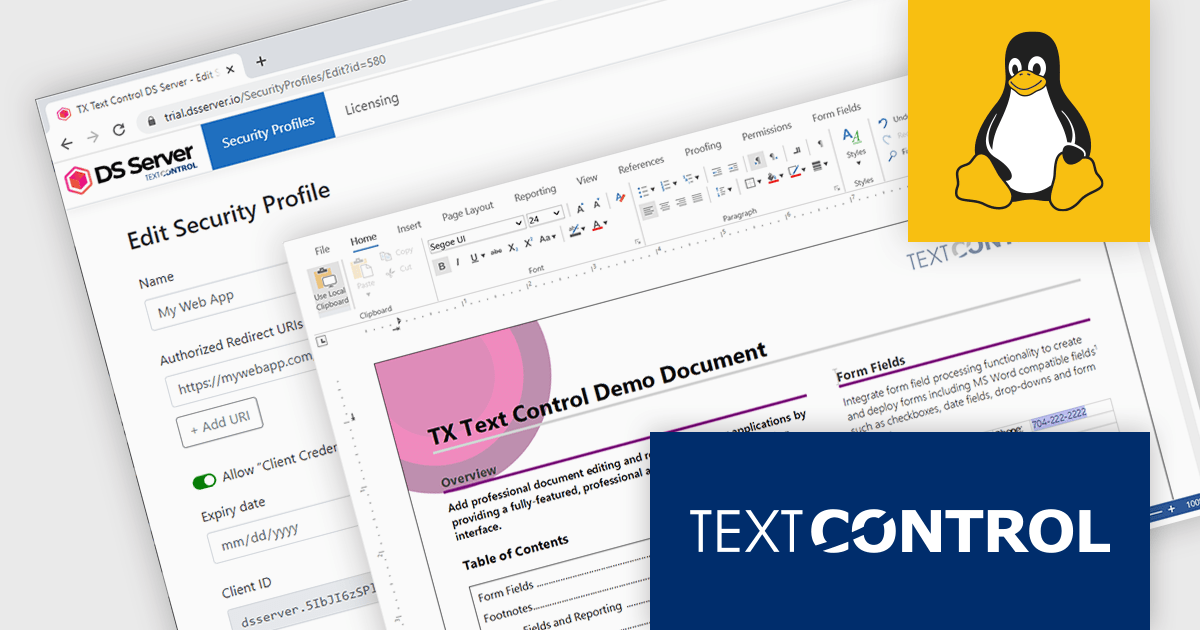
DS Server by Text Control is a powerful document processing backend designed to integrate seamlessly into web applications, providing developers with a robust set of APIs for creating, editing, viewing, and converting documents. Built for scalability and security, DS Server allows organizations to automate document workflows within their own infrastructure or cloud environments, eliminating the need for external dependencies. With support for popular formats like DOCX, PDF, and HTML, it enables rich document capabilities while maintaining full control over data and compliance. Whether you're generating dynamic reports, creating user-editable templates, or embedding secure document viewers, DS Server delivers high-performance document services tailored to modern application needs.
The DS Server by Text Control 4.0 update introduces full Linux support, significantly expanding its deployment versatility. Users can now run DS Server on a range of Linux environments, including virtual machines, bare-metal servers, Docker containers, and popular platform-as-a-service (PaaS) offerings such as Azure App Service for Linux and AWS Elastic Beanstalk. This move enables organizations to integrate DS Server into their existing Linux-based infrastructure, reducing reliance on Windows environments and optimizing for cost, performance, and scalability in cloud-native and on-premise setups.
To see a full list of what's new in version 4.0, see our release notes.
Text Control DS Server is licensed per server and is available as an Annual License that includes software updates. See our Text Control DS Server licensing page for full details.
For more information, visit our Text Control DS Server product page.
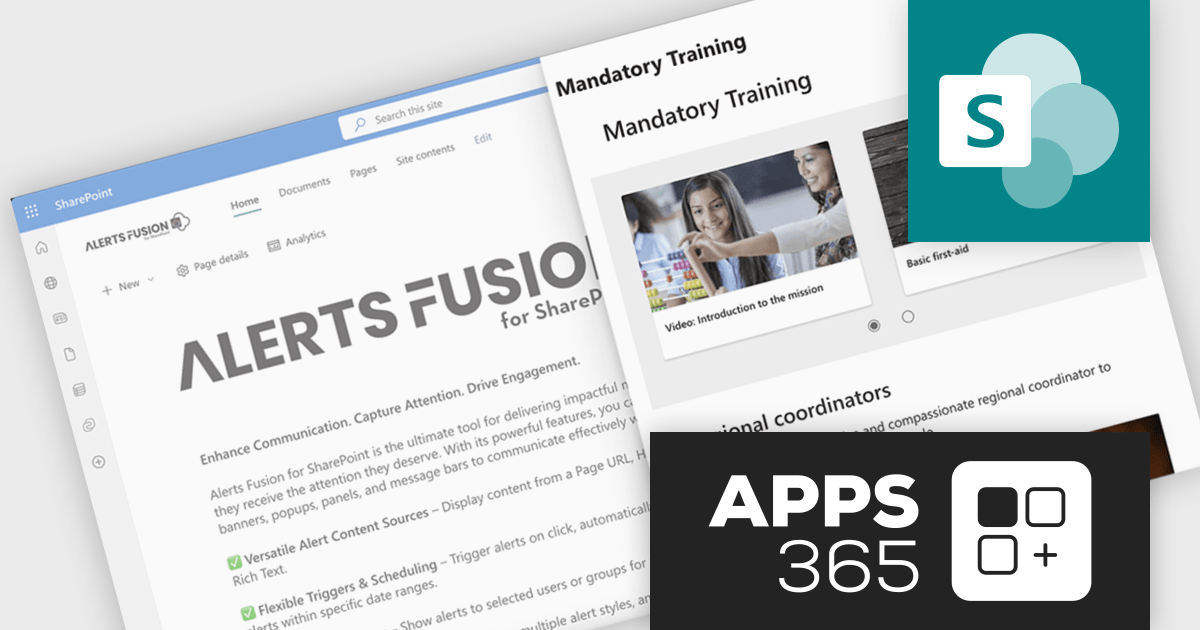
SharePoint Alerts Fusion by APPS 365 is a notification solution designed to improve the way organizations communicate important messages across their Microsoft SharePoint environment. Integrated directly with SharePoint, it enables administrators to create and distribute visually prominent alerts and announcements that are instantly visible to targeted users or groups. The solution supports scheduled and recurring notifications, rich formatting options, and multilingual support, ensuring that messages are delivered clearly and consistently within an organization’s preferred communication channels.
This tool is especially valuable for departments like IT, HR, and Compliance that frequently need to issue time-sensitive or mandatory updates. By pushing alerts to users via SharePoint pages, Alerts Fusion ensures high visibility and engagement without relying on passive communication methods. Common use cases include notifying users of service outages, policy changes, onboarding resources, or company-wide announcements. The product enhances internal communication by reducing message fragmentation and improving the consistency and reach of critical information.
SharePoint Alerts Fusion is licensed per Tenant user and is available on an annual basis. It is offered as a Site License (Up to 500 Tenant users on 1 Site), a Site Collection License (Up to 2500 Tenant users on Unlimited Sites in a single Site Collection) or a Tenant License (Up to 10,000 Tenant users on Unlimited Sites in a Tenant). See our SharePoint Alerts Fusion licensing page for full details.
For more information, visit our SharePoint Alerts Fusion product page.
DataGrip is a multi-engine database environment that supports MySQL, PostgreSQL, Microsoft SQL Server, Oracle, Sybase, DB2, SQLite, HyperSQL, Apache Derby and H2. It includes an editor that provides intelligent coding assistance such as auto-completion, analysis and navigation. It also features a query console for running and profiling queries.
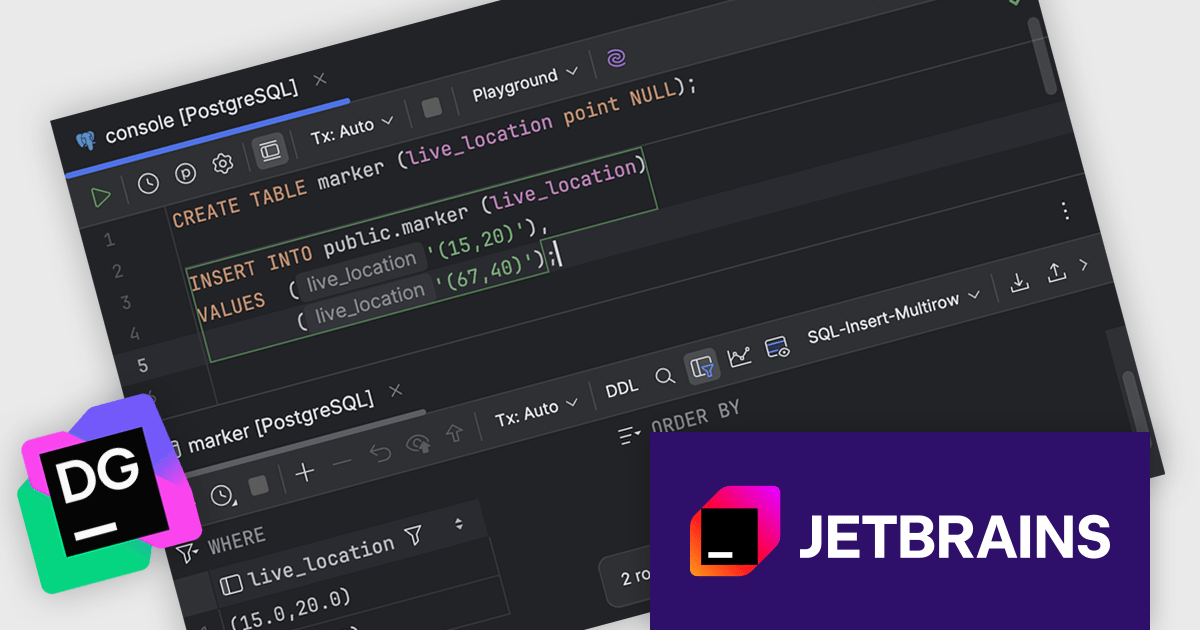
The JetBrains DataGrip 2025.1 release introduces a valuable new feature that improves working with spatial databases. DataGrip can now display raw geo-type values directly within the data grid for PostgreSQL, MySQL, and MariaDB databases. This enhancement enables developers and database administrators to view spatial data like coordinates, geometries, and other geo-types in their original format without needing additional conversions or external tools. This update makes spatial data management more efficient, accurate, and accessible within the everyday development environment.
To see a full list of what's new in version 2025.1, see our release notes.
DataGrip is licensed per user, and is available as a commercial annual subscription license. We can supply new subscriptions, subscription renewals, lapsed renewals, and additional user licenses. See our DataGrip licensing page for full details.
DataGrip is available to buy in the following products:
電話: (888) 850 9911
Fax: +1 770 250 6199


