


公式サプライヤー
公式および認定ディストリビューターとして200社以上の開発元から正規ライセンスを直接ご提供いたします。
当社のすべてのブランドをご覧ください。
Syncfusion Essential Studio UI Component Suite is a comprehensive collection of user interface controls designed to support the development of modern, high-performance applications across web, desktop, and mobile platforms. It provides a wide range of components, from data grids and charts to schedulers and rich text editors, all built with a consistent API and strong integration across frameworks such as .NET, JavaScript, and Flutter. With a focus on reliability, scalability, and ease of use, it enables development teams to accelerate application delivery while maintaining flexibility and control over the user experience..
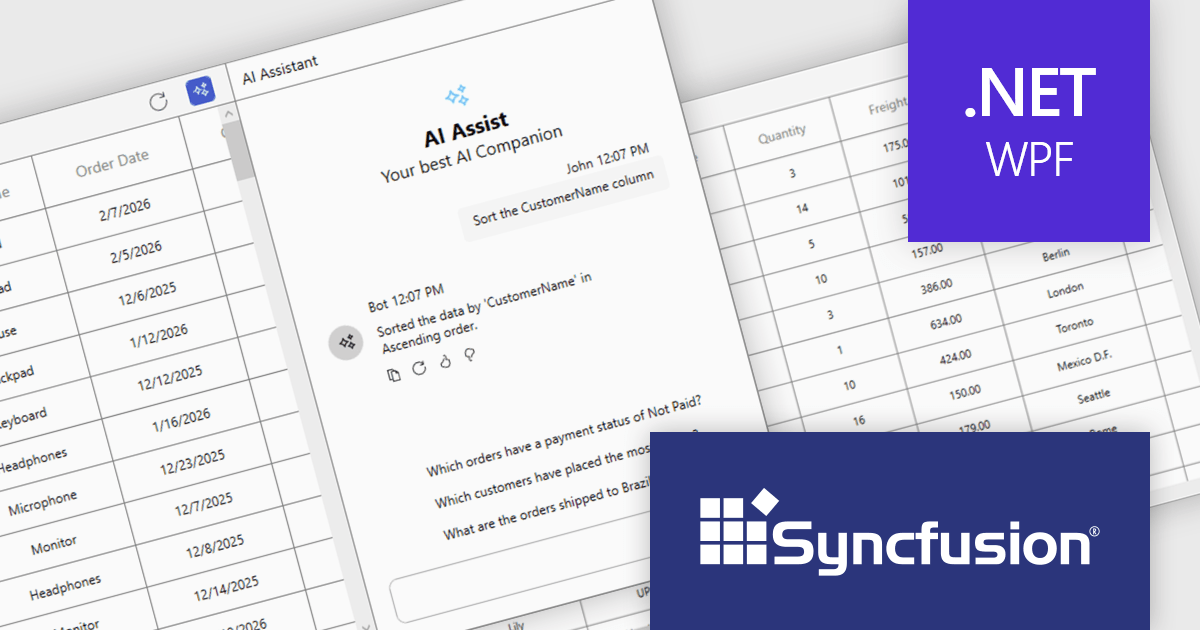
The Syncfusion Essential Studio UI Component Suite 2026 Volume 1 update introduces the Smart DataGrid, enabling developers to integrate natural language driven data interaction into modern WPF applications. This feature allows users to query, sort, filter, group, and highlight data through simple prompts, reducing the need for complex query logic and custom UI implementations. By supporting advanced scenarios such as multi condition filtering and contextual grouping, it improves development while maintaining flexibility and control. As a result, developers can deliver more intuitive data experiences faster, improve application usability, and reduce the overall effort required to implement rich data handling capabilities.
To see a full list of what's new in 2026 Volume 1 (33.1.44), see our release notes.
Syncfusion Essential Studio UI Component Suite is available as part of Syncfusion Essential Studio Enterprise which is licensed per developer and is available as a 12 Month Timed Subscription License which includes support and maintenance. See our Syncfusion Essential Studio Enterprise licensing page for full details.
Learn more on our Syncfusion Essential Studio Enterprise product page.
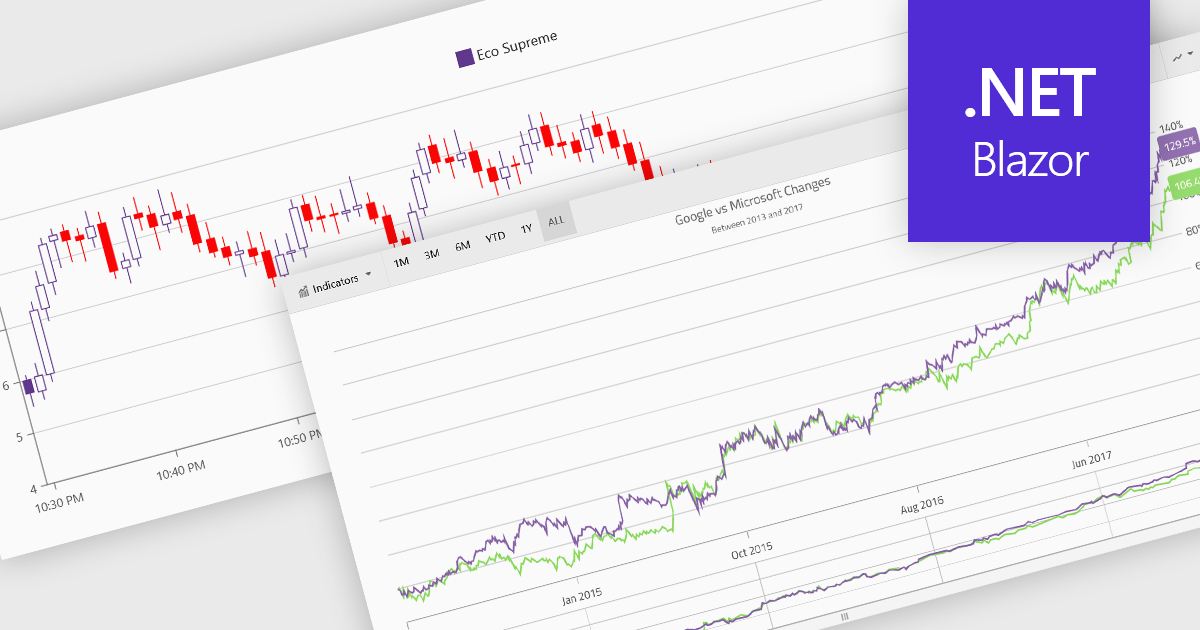
Financial charts are specialized visualizations designed to represent market data and price movements over time. Commonly used in trading platforms and analytical applications, these charts help users interpret open, high, low, and close values, as well as trends and volatility. By providing standardized financial visualizations, charting components enable developers to deliver tools that support technical analysis, decision-making, and real-time data exploration in finance-focused applications.
Common features include:
For an in-depth analysis of features and price, visit our Blazor charts components comparison.
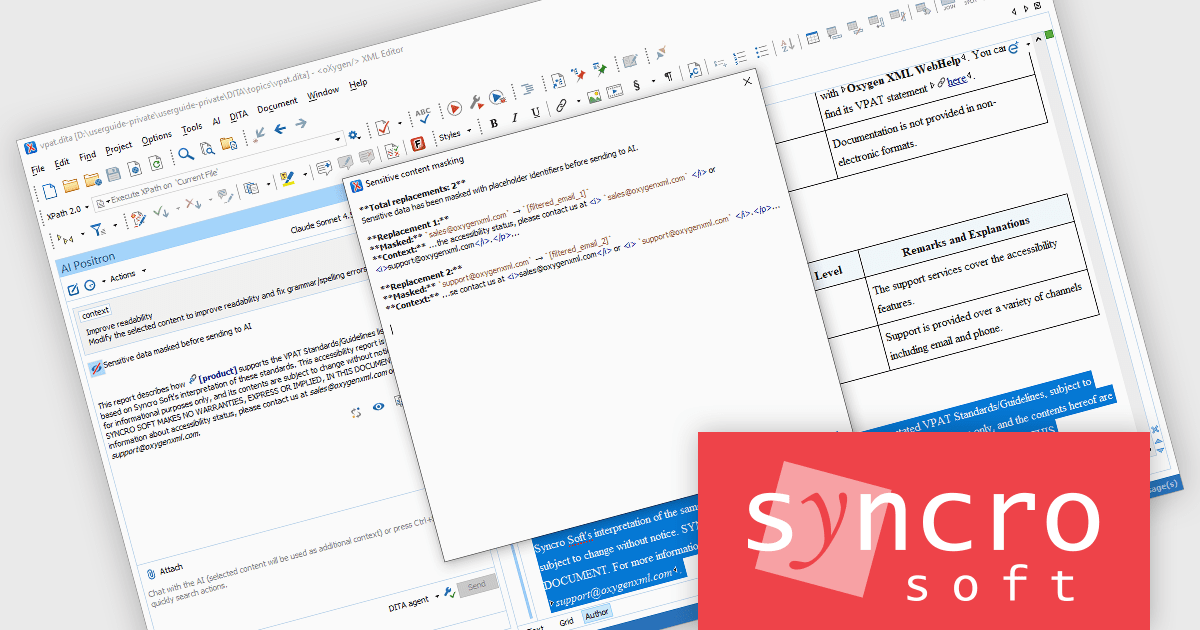
The Oxygen AI Positron Assistant Enterprise Plug-in by Syncro Soft is an Artificial Intelligence powered extension for the Oxygen XML editing suite designed specifically for technical writers. It leverages OpenAI, Microsoft Azure OpenAI Service, or Anthropic Claude to automate repetitive tasks, improve content structure and flow, and generate draft text based on user prompts. The plugin easily integrates within the Oxygen environment, offering visual comparisons of suggested changes and allowing developers to control the creative process through ongoing prompts and revisions..
Oxygen AI Positron Assistant Enterprise adds the ability to mask sensitive data for AI requests. As teams increasingly rely on AI services for tasks such as content generation, validation, or transformation, protecting confidential information becomes essential. Data masking ensures that sensitive fields, such as personal data, credentials, or proprietary information, are automatically obfuscated before being sent to external AI systems. This allows organizations to benefit from AI-driven productivity while reducing the risk of data exposure, supporting regulatory compliance, and maintaining trust in environments where secure data handling is a priority.
Oxygen AI Positron Assistant Enterprise is licensed per Named user and is available as a Timed License with support and maintenance subscription. See our Oxygen AI Positron Assistant Enterprise licensing page for full details.
Learn more on our Oxygen AI Positron Assistant Enterprise product page.
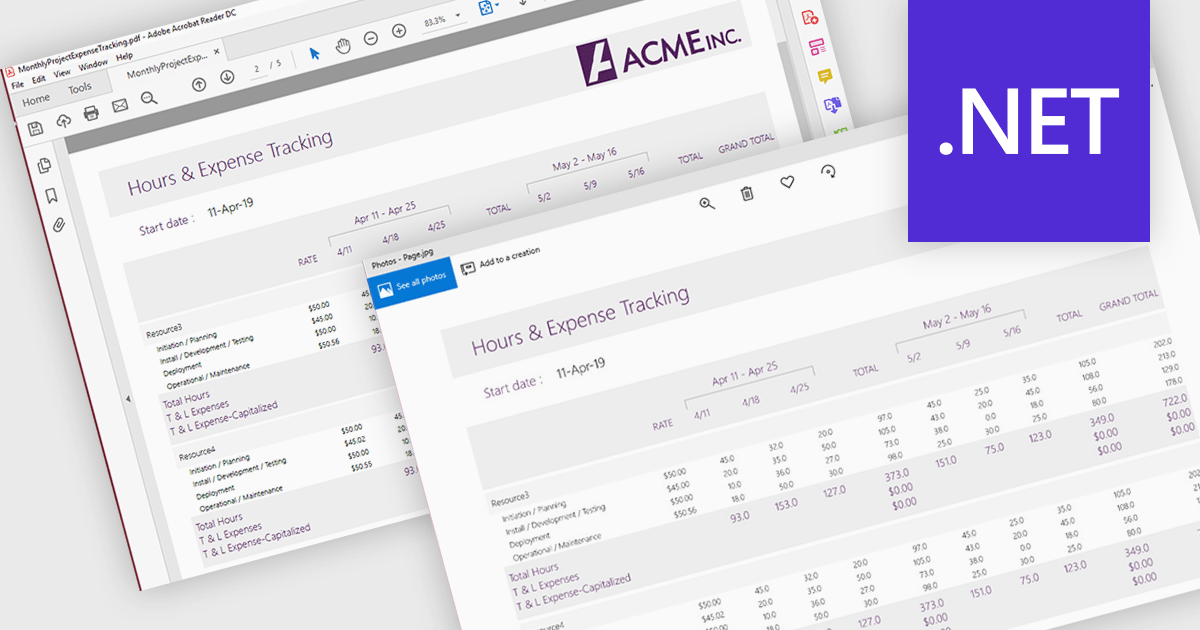
PDF to image conversion support in a PDF viewer component refers to the ability to render one or more pages of a PDF document as raster images, such as PNG or JPEG, directly within the application or for export. This capability is typically built on top of the viewer’s rendering engine and allows developers to generate visual representations of document content. It is useful for scenarios such as generating thumbnails, enabling previews in environments where PDF rendering is not supported, simplifying content sharing, or integrating with image-based processes like OCR (optical character recognition) and reporting.
Several .NET PDF Viewer controls allow you to convert a PDF to an image including:
For an in-depth analysis of features and price, visit our .NET PDF Viewer controls comparison.

ComponentSource and Intelligent Converters have built a strong 10 year partnership centered on helping developers and organizations simplify complex database challenges. Intelligent Converters specializes in database migration, conversion, and synchronization, delivering a wide range of tools that support systems such as Microsoft Access, MySQL, Oracle, PostgreSQL, IBM DB2, and Microsoft SQL Server. Their products are designed to balance high performance with ease of use, enabling users to manage and transfer data efficiently without requiring deep technical expertize.
One of their core products is the Oracle Migration Toolkit, a high performance solution for converting data to and from Oracle without relying on ODBC or middleware, with command line support for automation and scheduling.
This long standing collaboration enables ComponentSource to strengthen and differentiate its product offering by including specialized, high demand data conversion tools within its catalog. By partnering with Intelligent Converters, ComponentSource helps deliver these solutions to a global developer audience, ensuring reliable access, localized support, and a seamless purchasing experience worldwide.
Learn more about Intelligent Converters.
電話: (888) 850 9911
Fax: +1 770 250 6199


