


公式サプライヤー
公式および認定ディストリビューターとして200社以上の開発元から正規ライセンスを直接ご提供いたします。
当社のすべてのブランドをご覧ください。
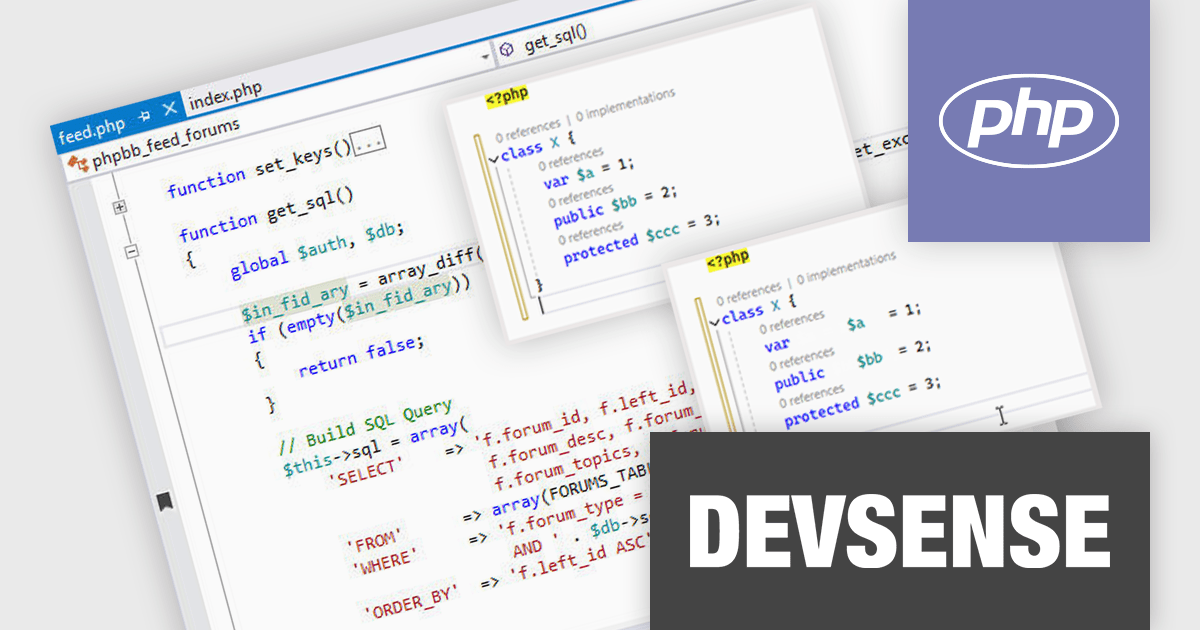
PHP Tools for Visual Studio converts Microsoft's IDE into a complete PHP development environment, increasing productivity with features such as smart code analysis, preemptive code completion, integrated debugging, and project management. This single package combines Visual Studio's familiar interface with industry-standard capabilities, allowing you to easily develop PHP applications and websites.
The PHP Tools for Visual Studio v1.81 release adds a new "Align Properties" code formatting feature which automatically arranges property declarations within class definitions into a consistent vertical alignment. Ensuring property declarations are consistently formatted in a clear visual structure makes it easier for developers to scan and understand quickly. This promotes a uniform style and improves the readability and maintainability of the codebase.
To see a full list of what's new in v1.81.19965, see our release notes.
PHP Tools for Visual Studio is licensed per developer and is available as a perpetual license with 1 year of upgrades and support. See our PHP Tools for Visual Studio licensing page for full details.
For more information, see our PHP Tools for Visual Studio product page.
ActiveState Platform enables you to build, certify and resolve your open source languages, automate your build engineering cycle, dependency management and check for threats and license compliance. Choose from ready-to-install open source language distributions for ActivePerl, ActivePython, ActiveTcl and ActiveGo. ActiveState Platform has advanced security features to manage and resolve security vulnerabilities within your projects.
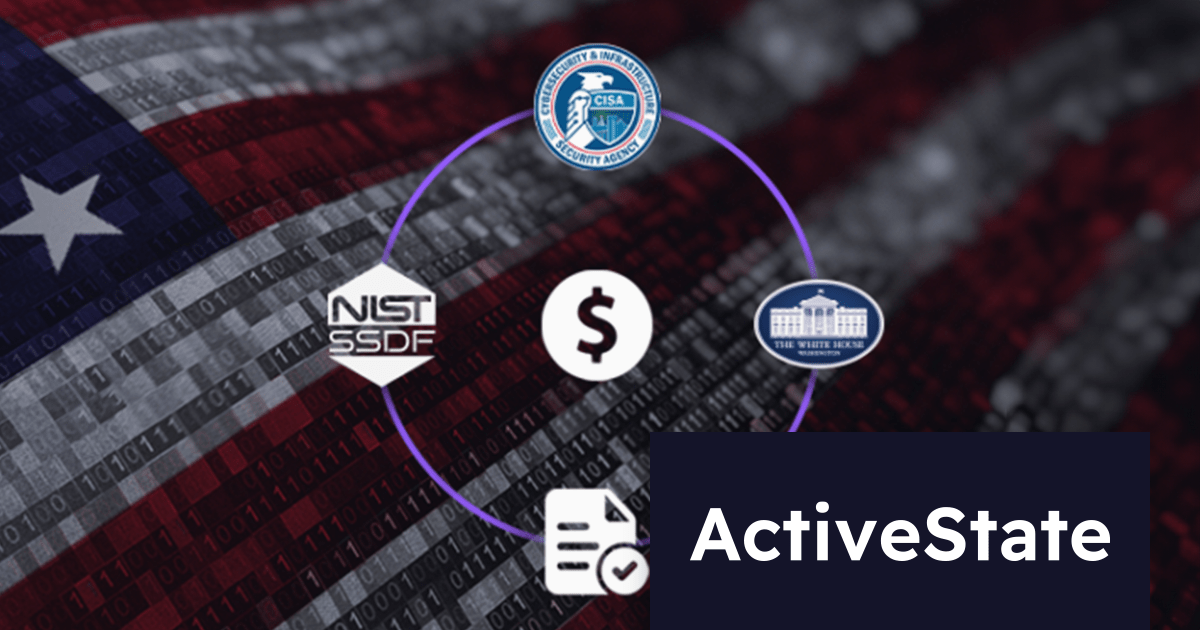
On Thursday, August 15th at 1:00 PM EDT, ActiveState will be presenting a webinar highlighting U.S. Government best practices for securing your software supply chain.
You will learn how ISVs can comply with new Federal Government regulations related to Open Source use, and how the ActiveState Platform can help on this front. Key topics include:
Register for the Webinar today, and mark your calendar for August 15th!
ActiveState Platform is licensed per developer as an Annual license. See our ActiveState Platform licensing page for full details.
Learn more on our ActiveState Platform product page.
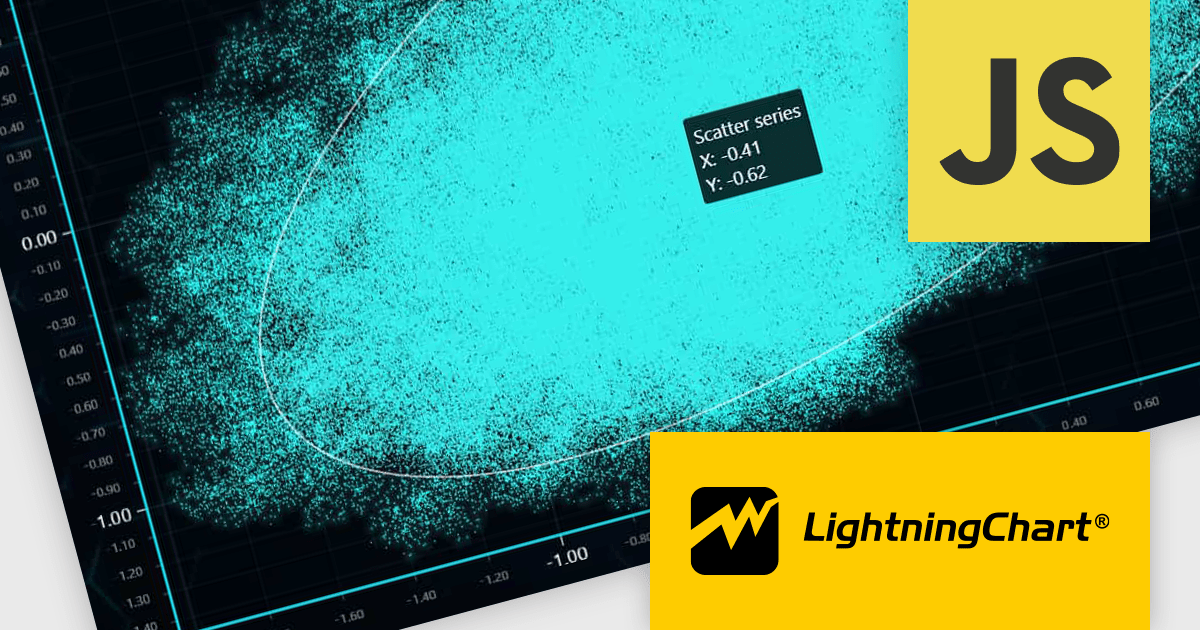
LightningChart JS is a high-performance JavaScript charting library optimized for real-time data visualization. Leveraging WebGL and GPU acceleration, it enables developers to create interactive, complex charts capable of handling massive datasets with high refresh rates. Ideal for applications demanding rapid data updates and smooth interactions, LightningChart JS provides a robust API for customization and integration into web-based projects.
The LightningChart JS v6.0.0 update introduces enhanced cursor capabilities, providing developers with greater control over cursor behavior and appearance. New features include custom cursor shapes, dynamic cursor updates based on data points, and precise cursor positioning, allowing for more informative and interactive visualizations. These improvements facilitate the creation of tailored user experiences and enable developers to effectively convey complex data insights through intuitive cursor interactions.
LightningChart JS v6.0.0 cursor improvements include:
To see a full list of what's new in v6.0.0, see our release notes.
LightningChart JS is licensed based on method of deployment with options including SaaS Developer Licenses, Application Developer Licenses, and Publisher Developer Licenses. Each license is perpetual and includes 1 year subscription for technical support and software updates. See our LightningChart JS licensing page for full details.
Learn more on our LightningChart JS product page.
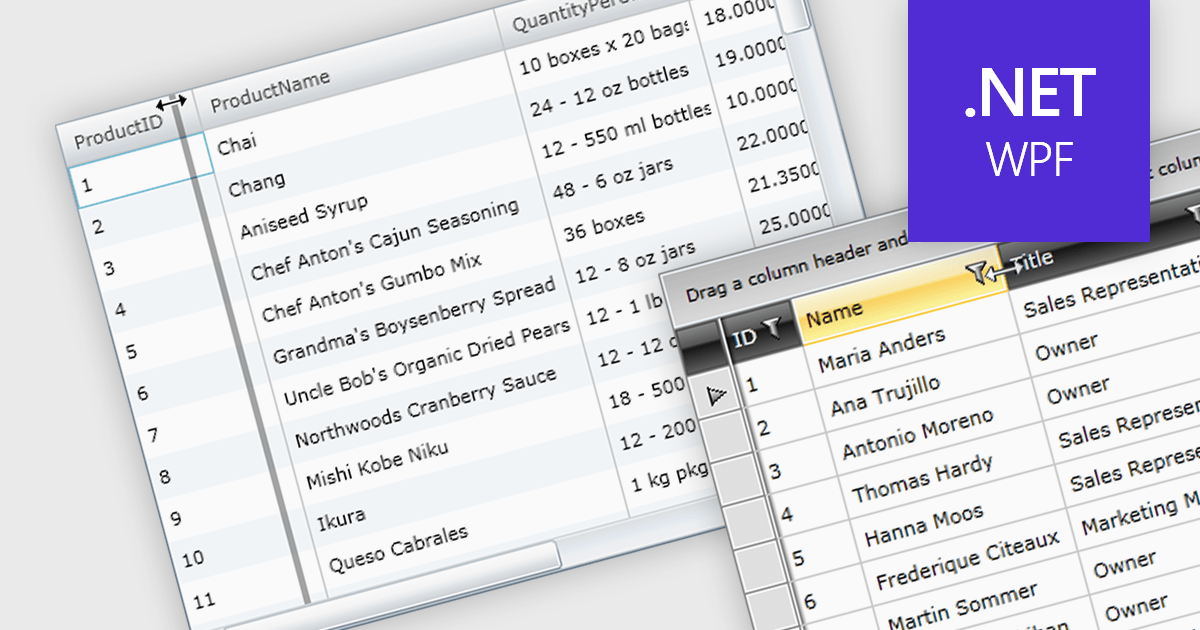
Column resizing in a datagrid empowers users to dynamically adjust column widths, enhancing data visibility and analysis. By dragging column boundaries, users can prioritize information, reveal hidden content, and improve readability. This flexibility accommodates diverse screen sizes, data volumes, and user preferences, ultimately optimizing the datagrid's usability for various tasks like data entry, reporting, and analysis.
Several WPF grid controls offer support for expanding and resizing columns including:
For an in-depth analysis of features and price, visit our WPF grid controls comparison.
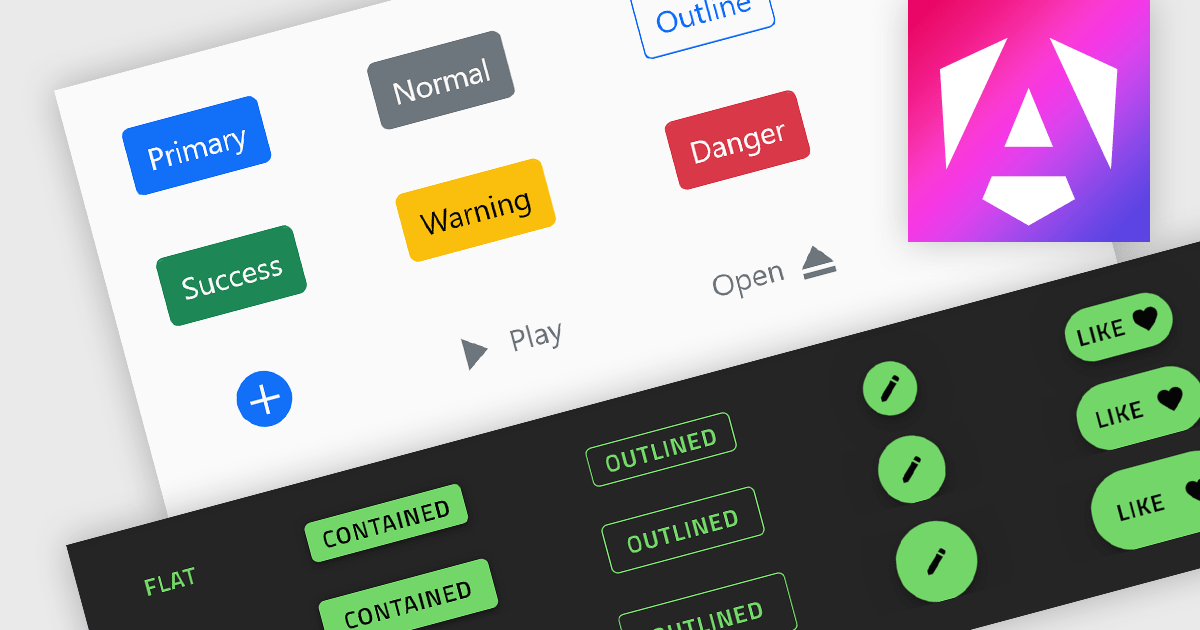
Button controls are specialized tools within design and content management systems that facilitate the creation, customization, and management of buttons. These controls empower users to effortlessly tailor button appearance, size, color, and functionality without requiring coding expertise, streamlining the design process and enhancing user interface consistency across digital platforms.
Several Angular data editor collections offer button editor controls including:
For an in-depth analysis of features and price, visit our Angular Data Editors comparison.
電話: (888) 850 9911
Fax: +1 770 250 6199


