
Froala Charts
Webとモバイルアプリケーションで反応性のよいレポートとダッシュボードの作成に使用できるインタラクティブなグラフを多数収録
Froala 社の製品
2020 年より日本国内にてComponentSourceで販売中。
この製品の販売は終了しました。
Webとモバイルアプリケーションで反応性のよいレポートとダッシュボードの作成に使用できるインタラクティブなグラフを多数収録
Froala 社の製品
2020 年より日本国内にてComponentSourceで販売中。

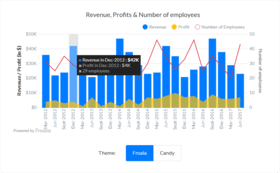
Froala Charts is a comprehensive library of JavaScript charts to create beautiful, responsive reports and interactive dashboards for web and mobile applications. Incorporating data visualization capabilities via interactive charts has been a growing need for enterprise app developers that are also using Froala Editor. Froala Charts bridges the gap. Draw quick insights from your data using the wide variety of visualizations from basic charts, widgets, to domain-specific charts and more. Choose from basic column charts, line charts, pie charts, combo charts, to powerful widgets such as gauges, KPIs, funnels, or advanced domain-specific charts such as timeseries, radar, chord, sankey, heat maps and more.


画像1 / 8
Froala Charts for your data visualization needs:
今すぐ Froala ライセンススペシャリストとライブ チャット。


電話: (888) 850 9911
Fax: +1 770 250 6199


