Perfinity .NET Runtime Analyzer
.NETアプリケーションのさまざまな種類のランタイムの問題を調査するための、使いやすいツールセット
Perfinity 社の製品
2021 年より日本国内にてComponentSourceで販売中。
価格:¥ 94,380 (税込)〜 バージョン: v9.0.4 更新日: Feb 11, 2025
The powerful line level sampling profiler and the ultra-fast, low-overhead instrumentation profiler provide functionality to quickly pinpoint performance bottlenecks within the app.
The integrated focus feature simplifies the analysis of complex applications to a minimum.
In addition, the tool supports event tracing to maximize the user experience. File I/O activity, network activity and debug events can be captured. That way interesting app insights can be correlated with the timeline. Data context information can be added to investigate internals of apps beyond code level.
The built-in timeline functionality empowers the user to process interesting time ranges.

画像1 / 5
The integrated .NET memory profiler empowers the user to identify the root causes for memory issues and resource leaks. The memory profiler is fast with minimal overhead in regards to memory consumption and execution times.
Features:

画像1 / 4
The built-in application event tracker captures interesting system and application event topics. For each traced event, the profiler provides timestamps and thread stacks information. For this purpose, the profiler can record both managed and native event triggers.
The tool can capture event activity with data context and error information, for instance:

画像1 / 4
Unexpected exceptions can be another interesting source of problems that may not only affect the performance of your application but also its functionality.
.NET Runtime Analyzer highlights all exceptions which occur during the application execution. For each exception, it shows thread stacks on a line-level base to indicate the source line from which the problem was raised.
Furthermore, the built-in exception profiler allows the analysis of specific exception types or exception creation stacks to display frequencies and their distribution within the timeline.

画像1 / 2
Sluggish application startup performance can be induced by poor software algorithms. We need to identify the root cause of these issues and fix the software.
Besides, we need to also provide the best infrastructure for our software to run. The key task then is to provide proper software deployment.
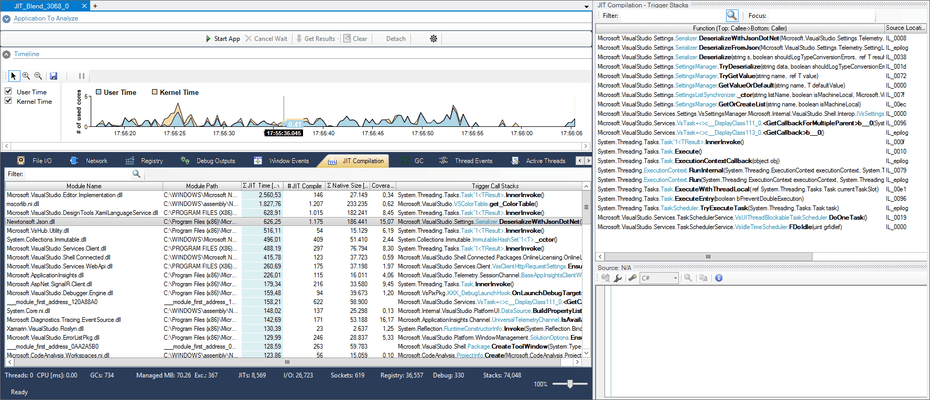
Before .NET software can run on the CPU, .NET assemblies must be translated from IL to native code. So we should deploy native images for assemblies which cause high time losses in order to minimize annoying runtime overheads.

