TeeBI(英語版)
RAD Studio用のビジネスインテリジェンスコンポーネント
Steema Software 社の製品
1998 年より日本国内にてComponentSourceで販売中。
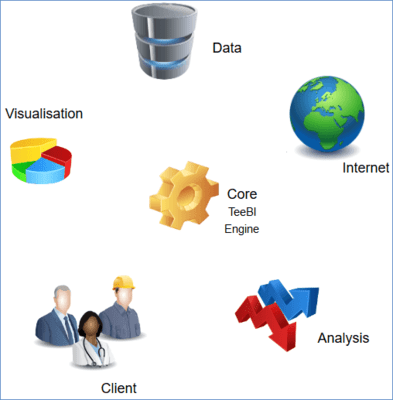
TeeBI is a performance-oriented API (component library) to enable data gathering, processing and optionally interacting with machine-learning algorithms.
Data can be created manually by code, or it can be automatically imported from many different sources and formats, like databases, files as csv, json, xml, Excel, etc. both by code or using editor dialogs.
Data can be optionally persisted to native binary files that provide ultra-fast access, as each column or field is directly stored from a simple array in a single operation. Millions of rows take few instants to load, sort, aggregate or traverse.
Basic summary features like filtering, sorting, expressions, aggregations and multiple group-by consolidations can be done using simple classes and/or visual editor dialogs. No sql is required, but it is supported.


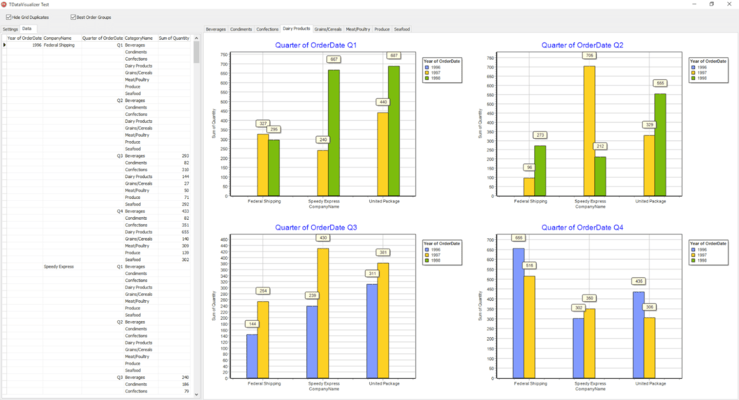
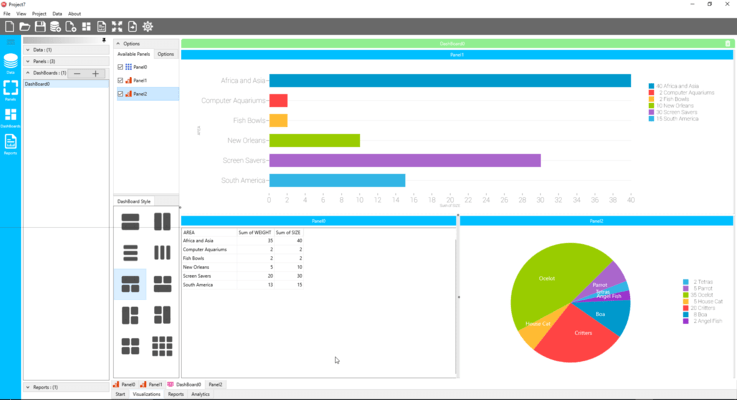
TeeBI provides an array of chart types, grids and customization options to easily create beautiful and detailed data visualizations for instant analysis. Dashboards and reports can be built from multiple data sources and types. Plugin your own favorite Chart & Grid or use Steema's own BIGrid & BIChart.


Integrations with the "R" Language and Python's frameworks provide an easy way to use TeeBI data with statistical and machine-learning algorithms and perform statistical and predictive analysis to help identify patterns and trends.

