TeeChart .NET for Avalonia
デスクトップ、Web、モバイルアプリ向けの対話式のグラフとマップ、ゲージ
Steema Software 社の製品
1998 年より日本国内にてComponentSourceで販売中。
価格:¥ 78,650 (税込)〜 バージョン: 2025 新機能 更新日: May 7, 2025
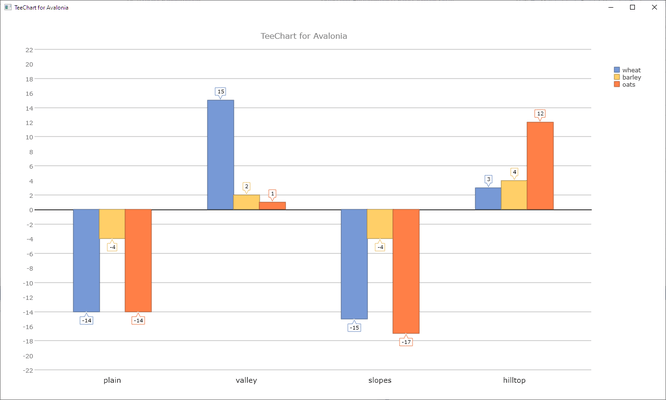
Avalonia's cross-platform UI framework for .NET, provides a flexible styling system supporting a wide range of operating systems such as Windows, Linux and MacOs. TeeChart takes advantage of this successful platform to create rich and highly qualified charts to enhance developer applications. You can use the XAML to set the chart's characteristics or code in C#.


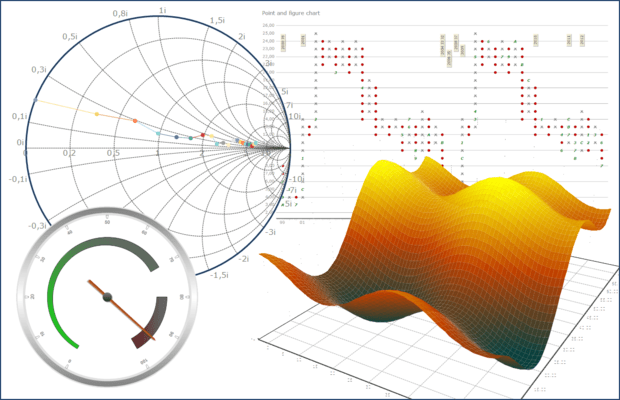
The Chart component is packed with functionality to produce high-class financial charting applications. Functions and indicators include: Open-High-Low-Close Series, Candle, Volume and Moving Average Convergence/Divergence (MACD), ADX, Stochastic, Bollinger Bands, Momentum, Moving Average and many more statistical functions. Enhanced Chart types include Surface, ColorGrid, Smith and several Gauge types.


Create multi-platform native .NET applications with professional and highly qualified charts, dashboards, graphs and maps. TeeChart also offers the possibility to render to web pages as live JavaScript.

