


公式サプライヤー
公式および認定ディストリビューターとして200社以上の開発元から正規ライセンスを直接ご提供いたします。
当社のすべてのブランドをご覧ください。

Thumbnail navigation in JavaScript PDF Viewers enables users to view miniature previews of pages within a PDF document, typically displayed in a sidebar or grid layout. These thumbnails provide users with a visual overview of the document's content, allowing for quick navigation and selection of specific pages.
Several JavaScript PDF Viewer components offer thumbnail navigation including:
For an in-depth analysis of features and price, visit our comparison of JavaScript/HTML5 PDF Viewer Components.
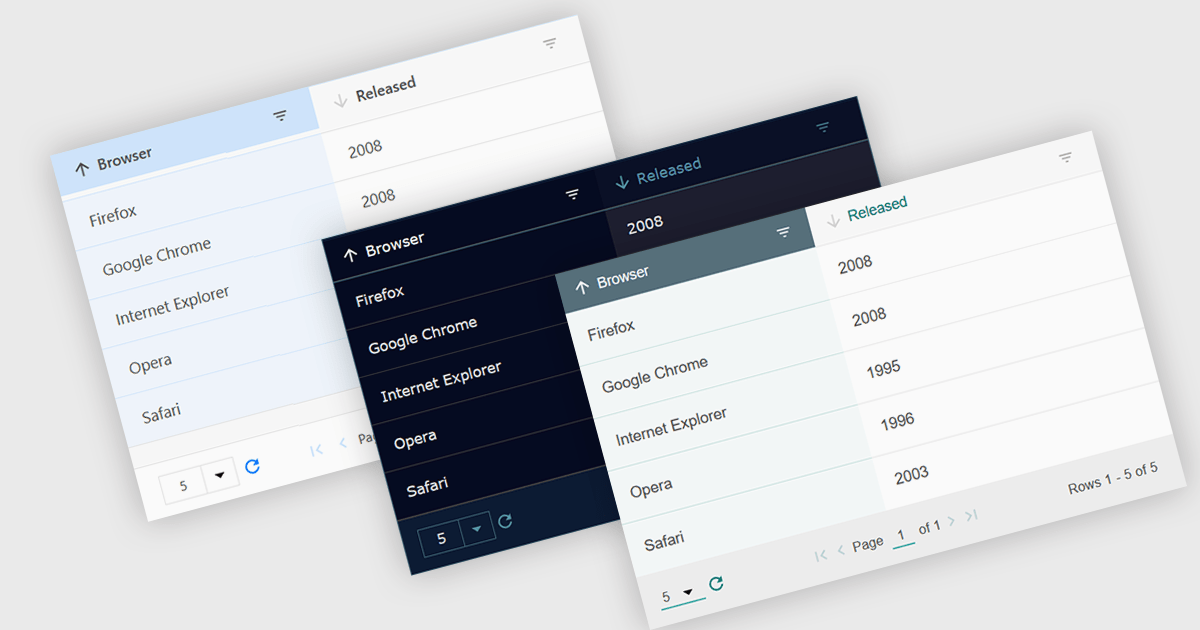
Customizable themes allow users to easily modify the visual appearance of a grid. This typically encompasses aspects like background colors, font styles, cell borders, and hover effects. These themes offer numerous benefits including improving the grid's readability and user experience by aligning it with the application's overall design aesthetic, enhancing data visualization by using color-coding or conditional formatting, and supporting accessibility needs by incorporating high-contrast themes.
Several Vue.js grid controls offer customizable theme support, including:
For an in-depth analysis of features and price, visit our comparison of Vue.js Grid controls.
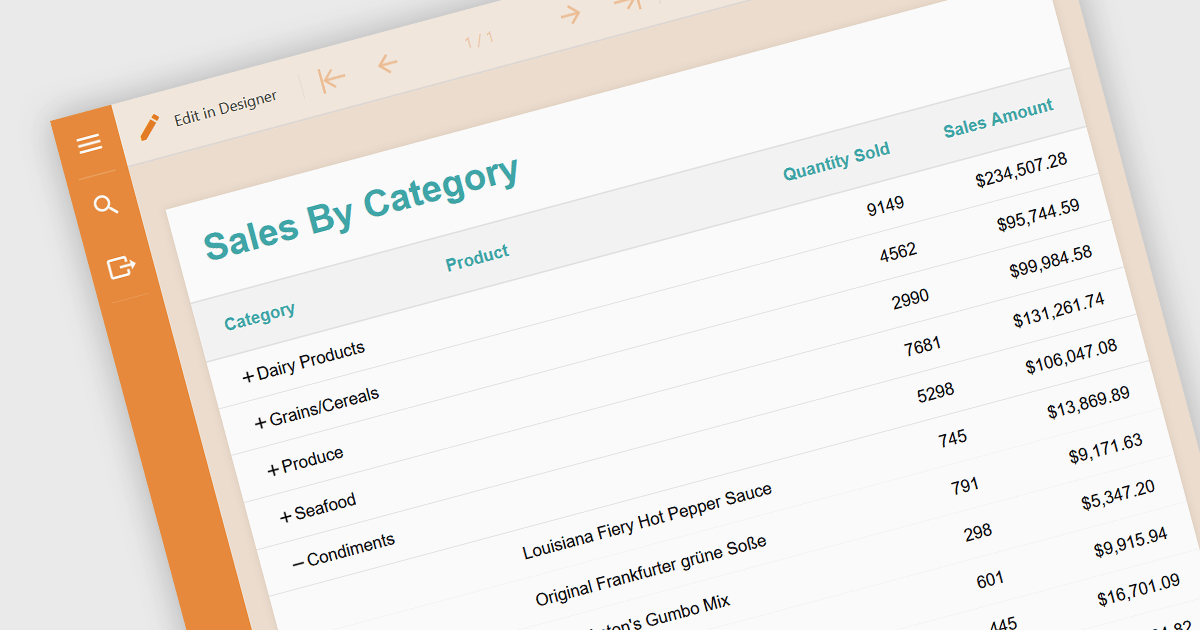
Drill-down is a feature often found in reports that allows users to explore data in greater detail, starting with a high-level summary, then clicking to navigate to progressively finer levels of detail. This helps to make complex data easier to understand and allows users to efficiently identify the underlying source of problems by iteratively analyzing successive layers of data immediately within the report. Drill-downs provide a continuous path from high-level overviews to specific data points, streamlining the process of detecting and addressing problems.
The following JavaScript reporting components offer drill-down support:
For an in-depth analysis of features and price, visit our comparison of JavaScript reporting components.
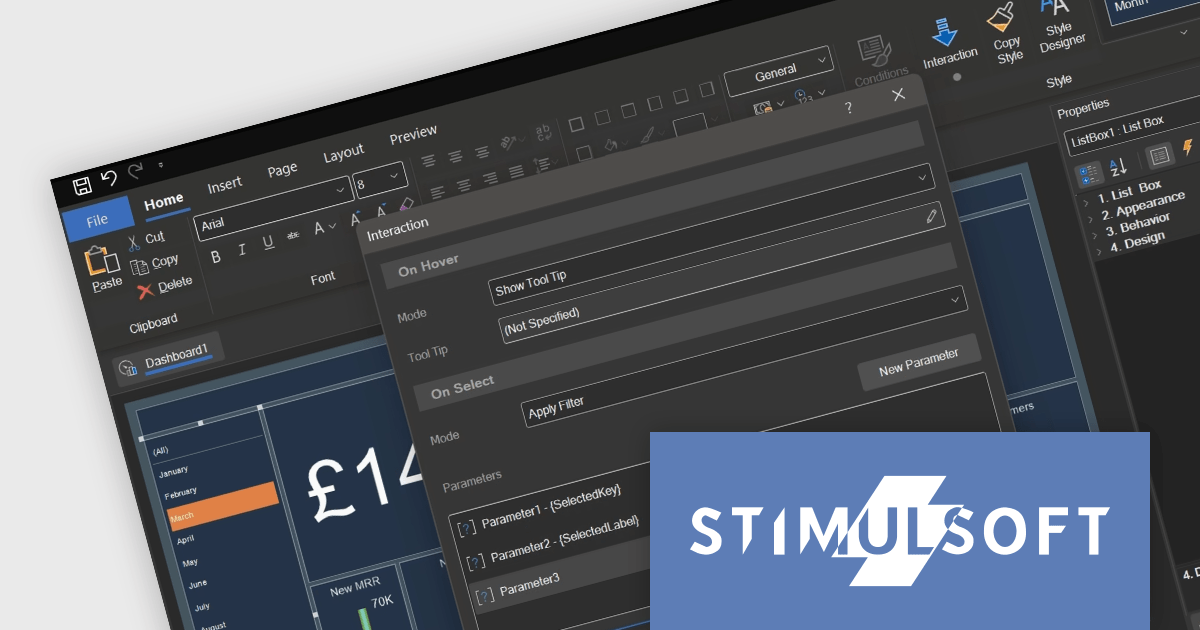
Stimulsoft Dashboards.JS is a JavaScript library designed for building interactive dashboards within web applications. It offers a comprehensive suite of tools for data processing, visualization, and dashboard design. Compatible with any HTML5 browser, it allows you to create a variety of dashboards for various purposes and integrates seamlessly with popular JavaScript frameworks like React and Vue.js.
The Stimulsoft Dashboards.JS 2024.2 update adds tooltip functionality for list box, combo box and shape elements. Hovering over an item can now reveal more information, providing additional details and context on demand. This intuitive feature empowers users to explore data and grasp its meaning at a glance, enhancing overall understanding.
For full details of what's new in version 2024.2, see our release notes.
Stimulsoft Dashboards.JS is licensed per developer and is available as a Perpetual license with 1 year support and maintenance. See our Stimulsoft Dashboards.JS licensing page for full details.
Stimulsoft Dashboards.JS is available to buy in the following products:
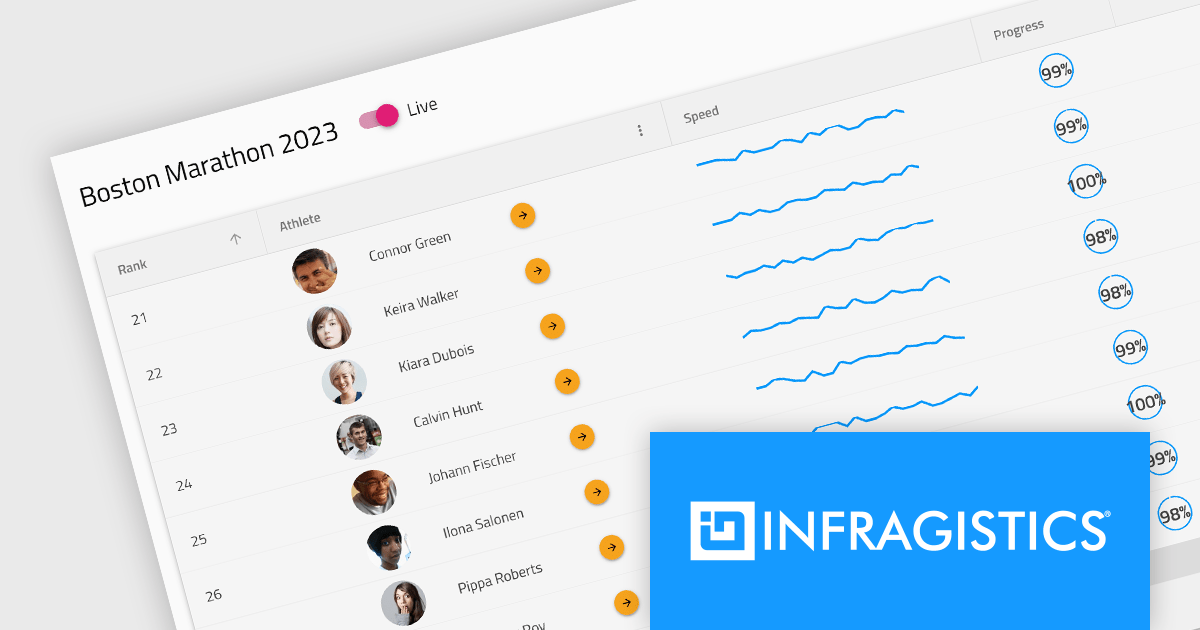
Infragistics Professional is a comprehensive toolkit for software developers, offering a wide range of pre-built, high-performance UI components for building visually appealing and feature-rich applications across Angular, React, Web Components, Blazor, ASP.NET MVC, ASP.NET Core, Windows Forms, WPF and Xamarin. It includes controls such as data grids, charts, navigation menus, and more, along with productivity tools to streamline development processes.
Infragistics Professional 23.2 includes the new Ignite UI Angular Data Grid, a full-featured modern component designed to enhance your data visualization capabilities. The grid boasts a rich set of features including data editing, selection, filtering, sorting, grouping, pinning, paging, templating, column moving, and exporting. This latest release brings even more functionality with collapsible column groups, column hiding, pinning, reordering, and moving capabilities. For customization, conditional styling allows for tailored aesthetics at the row or cell level. Advanced editing is empowered by a powerful API for Angular CRUD operations, and the grid also supports export to Excel, advanced filtering, and live data with real-time updates. These features, along with many more, provide a robust solution for all your data grid needs.
Infragistics Professional is licensed per developer and is available as a Perpetual License with a 1, 2 or 3 year support and maintenance subscription. See our Infragistics Professional licensing page for full details.
The Ignite UI for Angular Data Grid is available in the following products:
電話: (888) 850 9911
Fax: +1 770 250 6199


