


公式サプライヤー
公式および認定ディストリビューターとして200社以上の開発元から正規ライセンスを直接ご提供いたします。
当社のすべてのブランドをご覧ください。
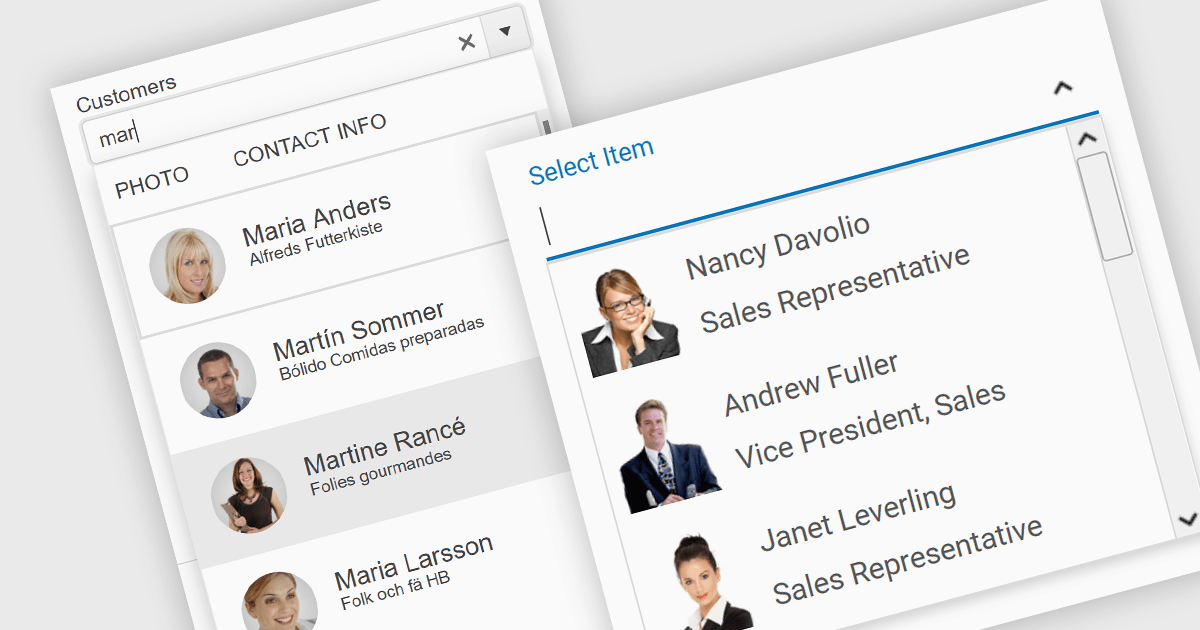
An image combobox is a custom UI component that combines a traditional dropdown menu with the ability to display an image alongside each item. Image comboboxes can enhance user experience by providing a more intuitive way to identify and select options, especially for items that benefit from visual representation. This approach can be particularly useful for non-text-based data or for catering to users who prefer visual cues.
Several JavaScript Data Editor controls support image combobox functionality including:
For an in-depth analysis of features and price, visit our comparison of JavaScript Data Editors.
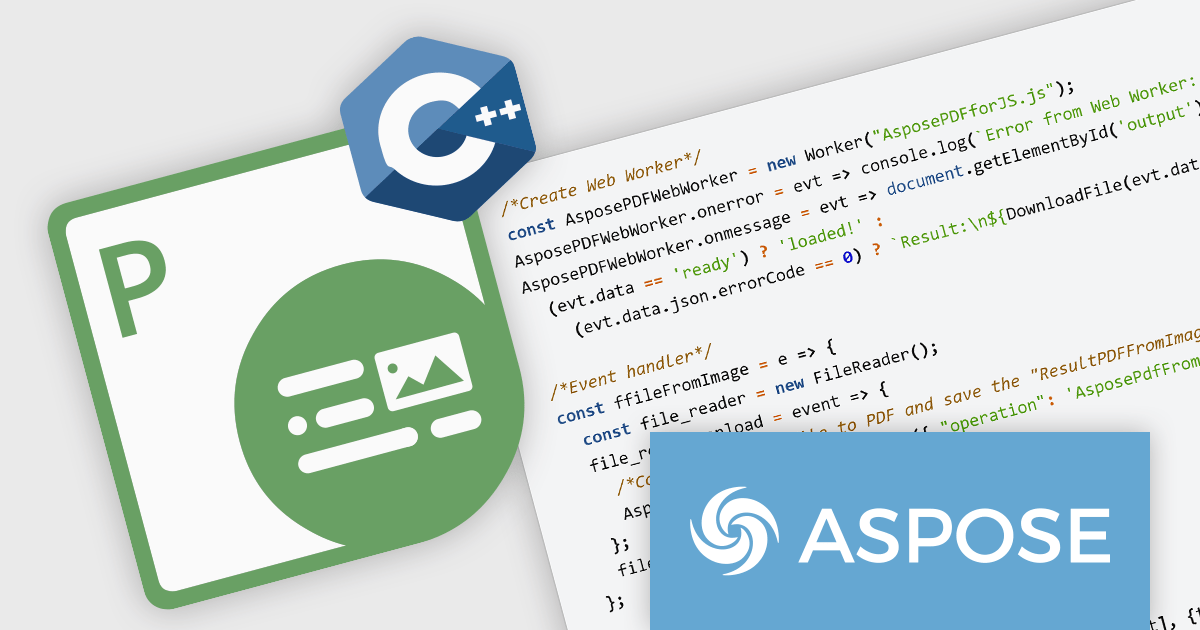
Aspose.PDF for JavaScript via C++ is a toolkit that empowers developers to manipulate PDF files directly within web browsers. Built on WebAssembly technology, it offers a secure and scalable solution for adding features like generation, viewing, editing, and conversion of PDFs to your JavaScript applications. This library, written in C++, eliminates the need for additional runtime environments, ensuring broad browser compatibility.
The Aspose.PDF for JavaScript via C++ V24.3 release adds a new AsposePdfFromImage API that allows you to convert image files to PDF format. This easy-to-use API grants developers the ability to integrate and automate the transformation of PNG, JPG, BMP, GIF, and TIFF files into universally accessible, secure, and easily manageable PDF files within web and desktop applications.
To see a full list of what's new in Aspose.PDF for JavaScript via C++, see our release notes.
Aspose.PDF for JavaScript via C++ is offered as Developer Small Business, Developer OEM, Developer SDK, Site Small Business, Site OEM, and Site SDK licenses catering to a range of business needs. Licenses are perpetual, and include 1 year of support and maintenance. Subscription renewals are also available. See our Aspose.PDF for JavaScript via C++ licensing page for full details.
Aspose.PDF for JavaScript via C++ is available in the following products:
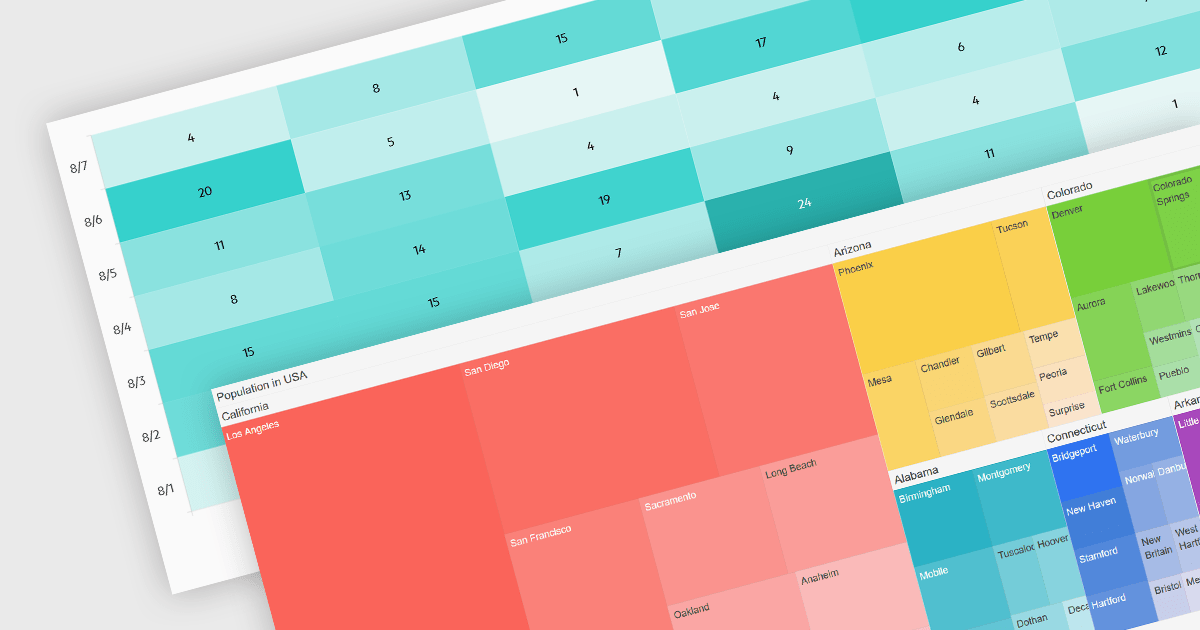
Heatmaps and treemaps are powerful data visualization tools that offer specific advantages when examining large datasets. A heatmap colorizes data values in a matrix, allowing for intuitive observation of trends, patterns, and outliers over two dimensions, making it helpful for spatial data analysis and correlation assessment. Treemaps exhibit hierarchical data as nested rectangles, with size and color variations indicating distinct quantitative values, allowing for effective use of space and fast comparison of proportions and relationships within hierarchical structures. Together, these chart types provide significant tools for visualizing and interpreting complex data, improving decision-making processes by presenting underlying data insights in a clear and actionable manner.
Several jQuery chart controls support the Heat and Treemap chart types, including:
For an in-depth analysis of features and price, visit our comparison of jQuery chart controls.
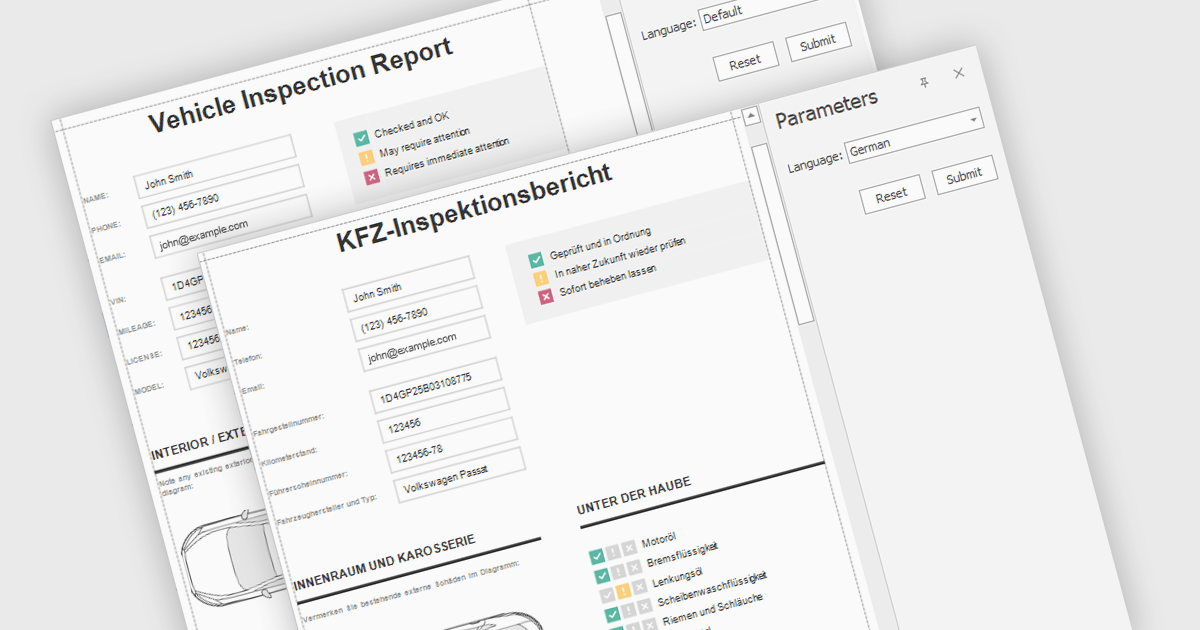
Report localization is the process of adapting a report for a target audience's language and cultural context. This involves translating text elements, formatting dates and currencies appropriately, and potentially adjusting the user interface to accommodate different reading habits such as right-to-left layouts. The goal is to ensure the report is clear, informative, and culturally sensitive for users worldwide.
Several React reporting controls offer localization including:
For an in-depth analysis of features and price, visit our React reporting controls comparison.
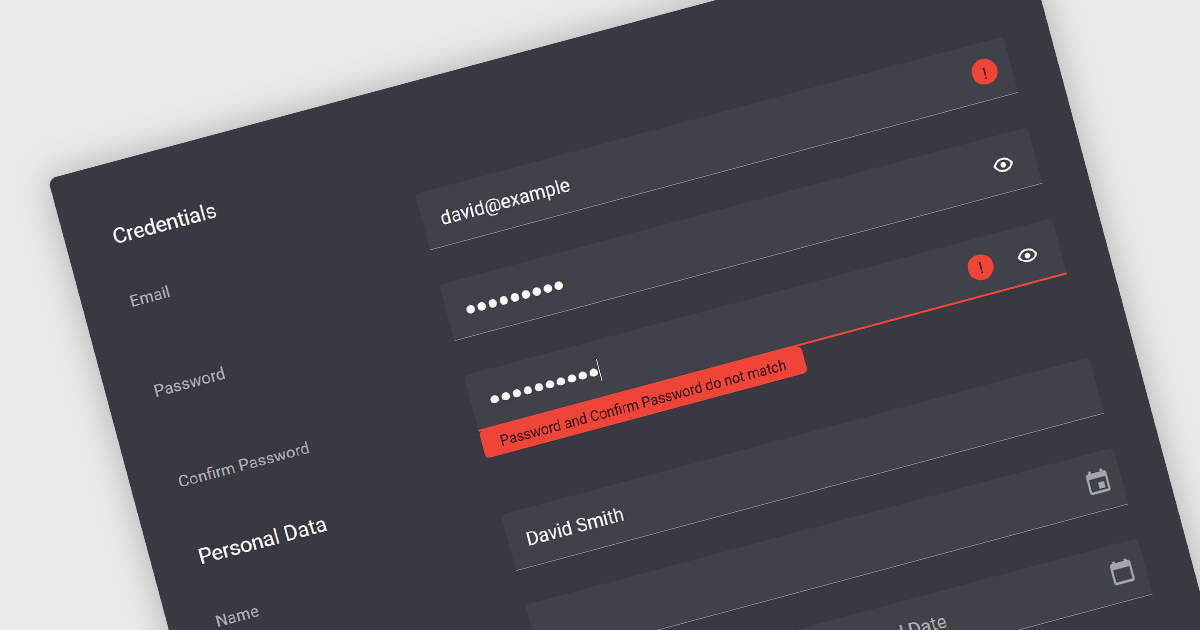
Validation in data editor controls refers to the process of ensuring user-entered information conforms to predefined rules. This helps prevent invalid or erroneous data from being stored in your application. By implementing data validation, you improve data integrity, reduce the need for manual data cleansing, and ultimately streamline the development process by catching errors early on.
Here are some examples of Vue.js data editors that support data validation:
For an in-depth analysis of features and price, visit our comparison of Vue.js Data Editors.
電話: (888) 850 9911
Fax: +1 770 250 6199


