













公式サプライヤー
公式および認定ディストリビューターとして200社以上の開発元から正規ライセンスを直接ご提供いたします。
当社のすべてのブランドをご覧ください。
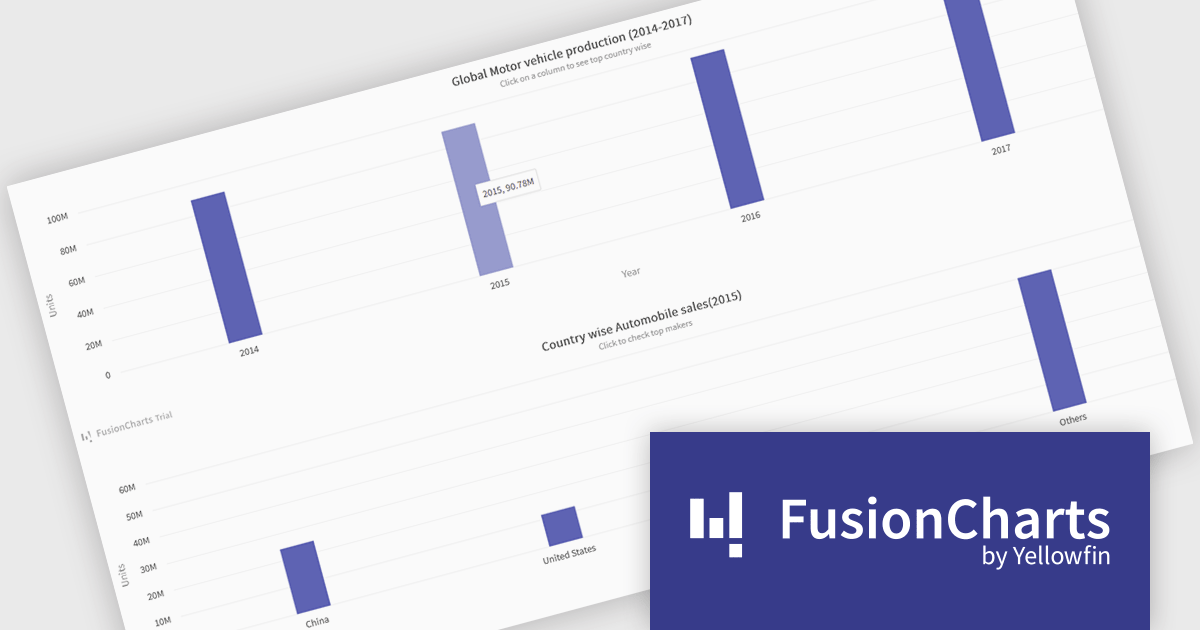
FusionCharts Suite XT is a collection of charting and mapping tools that helps developers create interactive and data-driven dashboards for their web and mobile applications. It provides a wide range of features, including over 100 chart types, data-driven maps, and a variety of customization options. FusionCharts Suite XT helps you visualize and present data in a clear and engaging way.
FusionCharts Suite XT allows developers to implement drill down charts that let users click individual data points to view related charts with more detailed information. This functionality helps developers present large or complex datasets in a structured way, allowing applications to display high level summaries while providing access to deeper data when required. By supporting multiple levels of drill down across most chart types, it supports scalable and interactive data exploration without overloading the initial visualization.
FusionCharts Suite XT is licensed through tiered plans, including Basic, Pro, Enterprise, and Enterprise+, available as annual or perpetual licenses for different developer and deployment needs. See our FusionCharts Suite XT licensing page for full details.
For more information, visit our FusionCharts Suite product page.
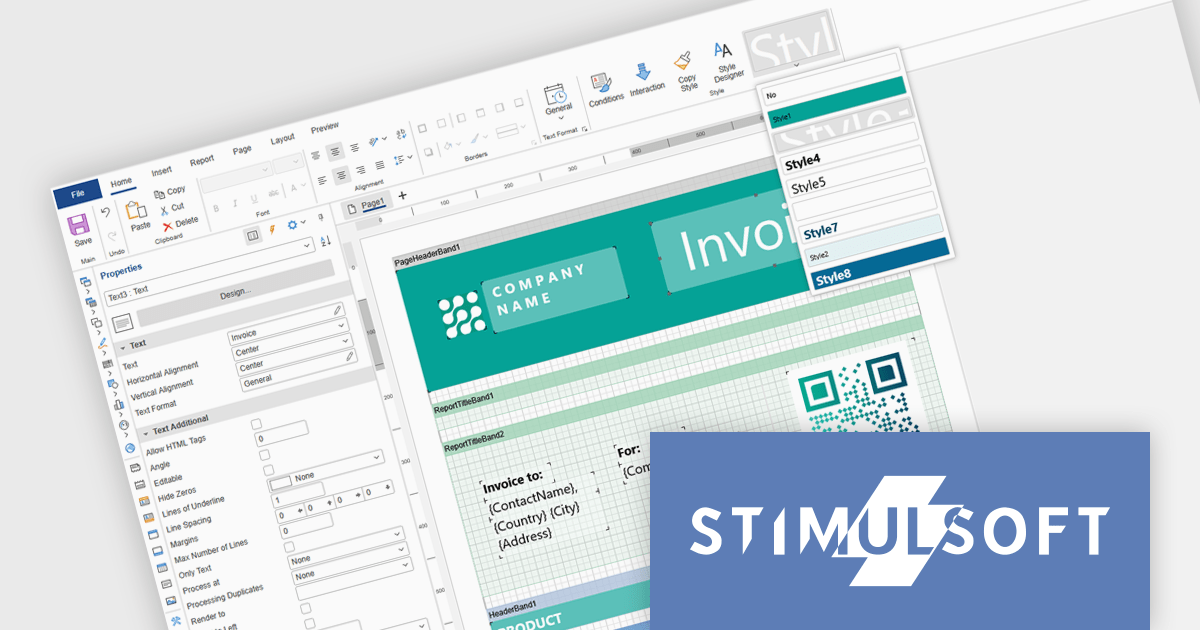
Stimulsoft Ultimate is a reporting and dashboard solution that provides a set of tools for building interactive reports and data visualizations across platforms, including WinForms, ASP.NET, .NET Core, Blazor, JavaScript, WPF, PHP, Java, and Avalonia. It enables developers and organizations to design, generate, and deploy professional reports and dashboards using visual designers, flexible styling options, rich charting and data visualization components, and extensive data connectivity. With support for multiple development environments and technologies, Stimulsoft Ultimate helps teams improve report creation, maintain consistent designs, and deliver clear, data-driven insights for business intelligence, analytics, operational reporting, and enterprise applications.
Stimulsoft Ultimate enables developers to apply centralized report styling that ensures consistent formatting across report elements while reducing the time required to design and maintain reports. By using reusable styles for fonts, colors, borders, and other visual properties, developers can standardize report layouts, quickly apply formatting to multiple components, and implement global design changes without editing each element individually. This approach improves development efficiency, simplifies maintenance, and helps teams deliver professional, visually consistent reports across applications and platforms.
Stimulsoft Ultimate is licensed per developer with Single, Team, Enterprise, and WorldWide options that support one to unlimited developers within an organization. Licenses include a 12 month subscription with updates, priority technical support, a royalty free runtime report designer and viewer, and a build server license for Team and higher tiers. See our Stimulsoft Ultimate licensing page for full details.
For more information, visit our Stimulsoft Ultimate product page.
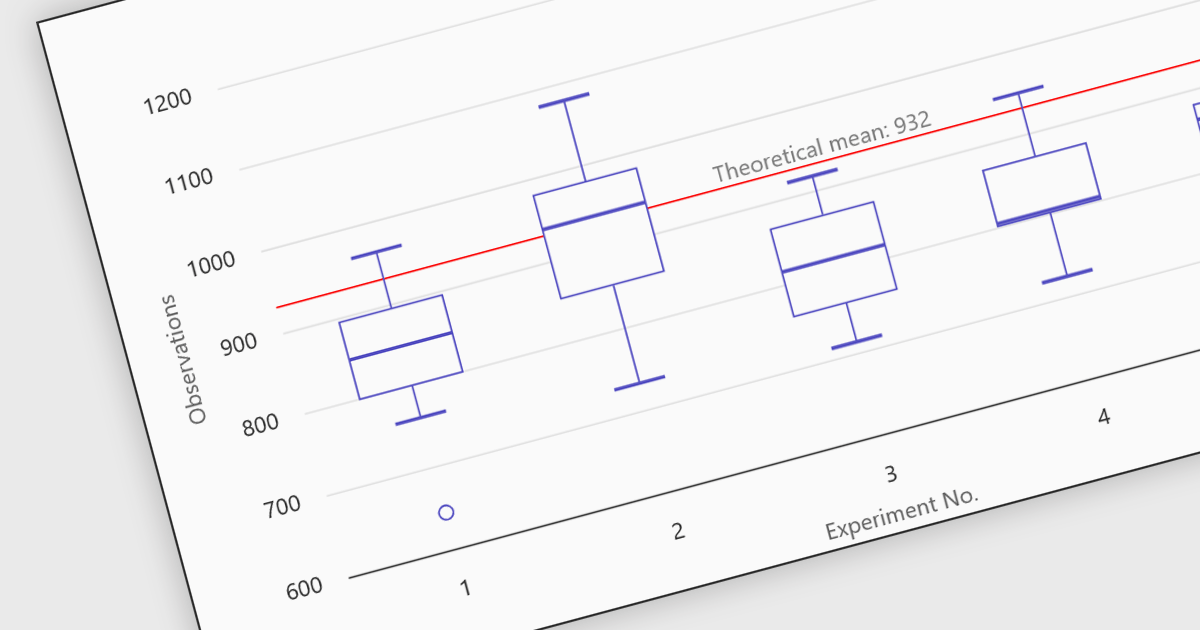
Box plots in React chart controls are statistical visualizations used to present the distribution of a dataset by highlighting key summary values, including the minimum, first quartile (Q1), median, third quartile (Q3), and maximum. In React applications, chart components render this information as a rectangular box representing the interquartile range, with lines known as whiskers extending to the minimum and maximum values, and optional markers indicating outliers. This visualization allows developers and analysts to quickly understand data spread, central tendency, and variability within a dataset. Box plots are commonly used in analytical dashboards, financial analysis tools, and scientific applications built with React, where comparing distributions and identifying anomalies across multiple data groups is important.
Many React chart controls support box plots including:
For an in-depth analysis of features and price, visit our comparison of React chart controls.
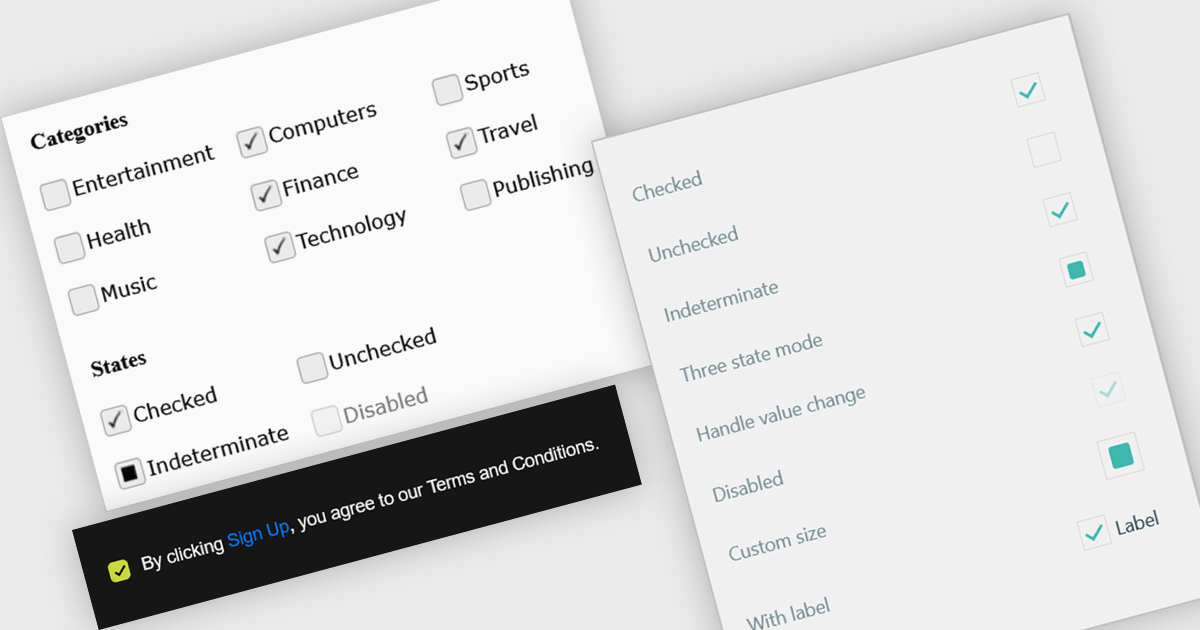
A check box is a user interface element that represents a Boolean field, allowing users to toggle between two states such as true and false directly within a form or data grid. It provides a clear and efficient way to edit logical values without requiring manual text input, reducing the risk of invalid entries and improving data consistency. For software developers, integrating check boxes into data-bound controls simplifies validation logic, and ensures that binary options are presented in a predictable and accessible format across applications.
Several React data editor collections provide check box editing capabilities including:
For an in-depth analysis of features and price, visit our comparison of React Data Editor components.
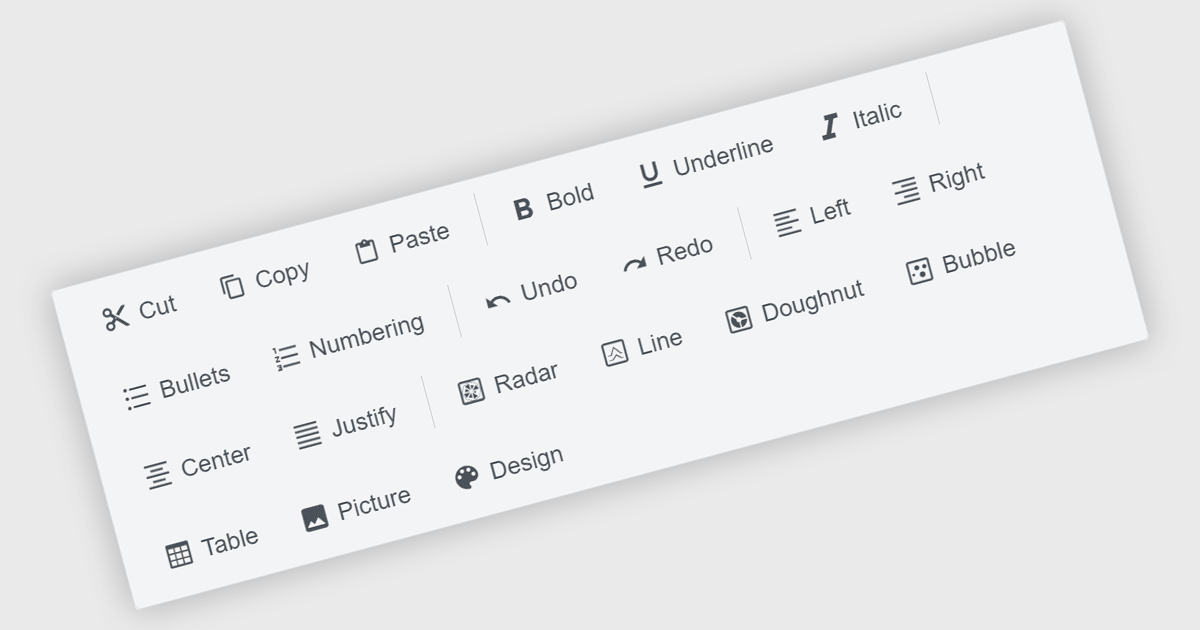
Toolbar components are a common feature in modern Angular UI suites, providing a structured way to present frequently used commands within an application. Typically displayed as a horizontal or vertical strip of buttons, icons, and interactive controls, a toolbar helps developers organize actions in a clear and accessible location. In Angular-based applications, toolbar components are often designed to work with the framework's component architecture, supporting features such as templating, responsive layouts, and integration with other UI elements like menus, dropdowns, and input controls. This allows developers to build consistent command surfaces while maintaining flexibility in how functionality is exposed to users.
Several Angular UI suites offer toolbar components including:
For an in-depth analysis of features and price, visit our Angular UI suites comparison.
電話: (888) 850 9911
Fax: +1 770 250 6199


