













公式サプライヤー
公式および認定ディストリビューターとして200社以上の開発元から正規ライセンスを直接ご提供いたします。
当社のすべてのブランドをご覧ください。
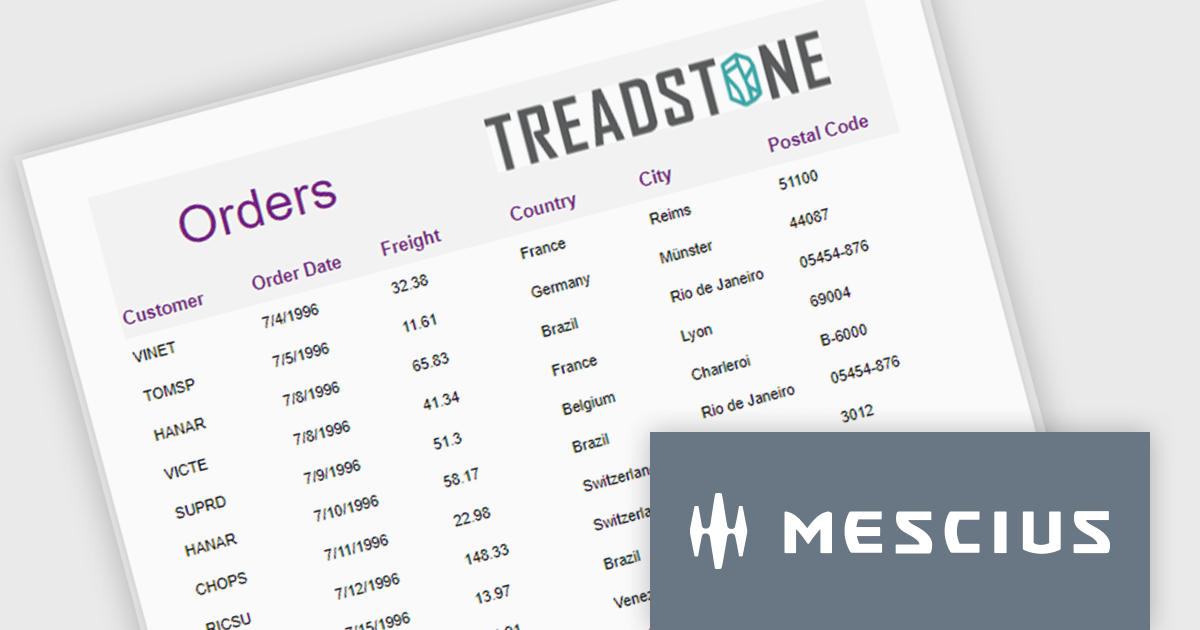
ActiveReportsJS is a robust JavaScript reporting tool that enables developers and report authors to seamlessly design and integrate interactive reports into web applications. It offers advanced features such as drill-down capabilities, runtime data filtering, and interactive parameters, enhancing the functionality and usability of reports. With compatibility across popular frameworks and the flexibility of its report designer component, ActiveReportsJS simplifies the visualization of diverse data sets, making it ideal for applications that require financial reporting, such as balance sheets, and other dynamic reporting needs.
In this blog post, MESCIUS Product Manager Joel Parks highlights real-world scenarios in where you can use ActiveReportsJS to provide users with the capability to define data sources on the fly, using Runtime Data Binding to dynamically inject data into your Angular Reporting component at runtime. Steps include:
This powerful capability gives your application the flexibility to generate customized reports based on user input, server logic, or changing data sources, without forcing the report designer to predefine every field.
Read the full blog to get started building powerful, dynamic reports.
ActiveReportsJS is licensed on an annual subscription or perpetual basis and is available as a Single Deployment License for non-commercial use, and as a Single Domain License or Unlimited Domain License for commercial and/or SaaS use. See our ActiveReportsJS licensing page for full details.
For more information, visit our ActiveReportsJS product page.
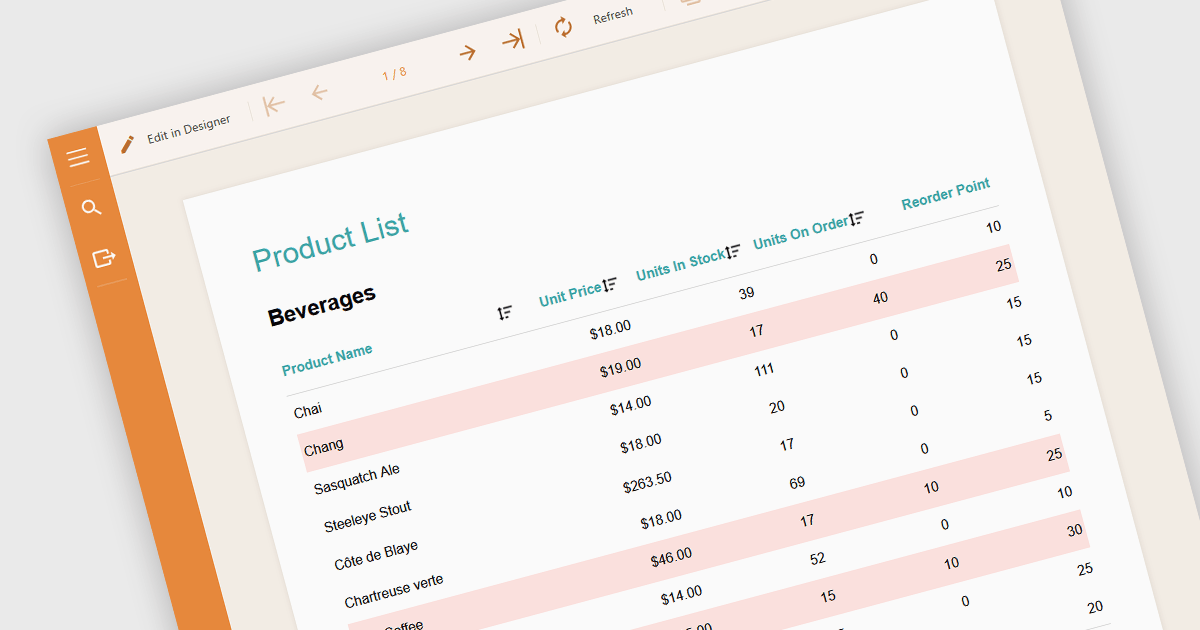
Conditional formatting in a report is a feature that automatically applies visual styles, such as font or background color, to the content within the report based on logical conditions or the data values themselves. This technique allows users to highlight trends, anomalies, or key thresholds by dynamically adjusting the appearance of report elements according to predefined rules, which is especially useful in performance monitoring or exception tracking scenarios. It improves the readability of data-heavy reports by making important information stand out, helping users quickly identify patterns, exceptions, or performance issues. For developers and analysts, it provides a practical way to make complex datasets easier to interpret without manual intervention.
Several Angular reporting components allow you to apply conditional formatting, including:
For an in-depth analysis of features and price, visit our comparison of Angular reporting components.

Highcharts is a JavaScript charting framework that allows web developers and data analysts to generate dynamic, visually appealing charts and graphs for websites and web applications. It can display a variety of chart types, including line, spline, area, column, bar, pie, scatter, and many more. Highcharts is well-known for its ease of use, rich documentation, and ability to handle huge datasets efficiently. Features include responsive design, accessibility support, and cross-browser compatibility. Its customization capabilities allow users to create bespoke data visualizations that increase engagement and provide insightful data presentations.
Highcharts has introduced a major update for React developers, focusing on a smoother and more natural experience when working with charts in React applications. The newly refined API now mirrors common React patterns, allowing developers to write less boilerplate and avoid workarounds. Integration is more seamless too - custom React components can be passed directly into chart configurations, enabling dynamic, reusable elements like tooltips and data-fetching containers without resorting to hacks. The update also brings full support for ECMAScript Modules (ESM), aligning with modern JavaScript standards and enabling better build optimization. With this release, Highcharts continues to provide a comprehensive set of chart types, from basic line graphs to advanced stock visualizations, all within a React-friendly environment.
Highcharts Core is licensed on an annual or perpetual basis, OEM licenses, and Advantage Renewals. It is licensed per Developer and has several license options including Internal, SaaS, SaaS+, and Self Hosted. See our Highcharts Core licensing page for full details.
Learn more on our Highcharts Core product page.
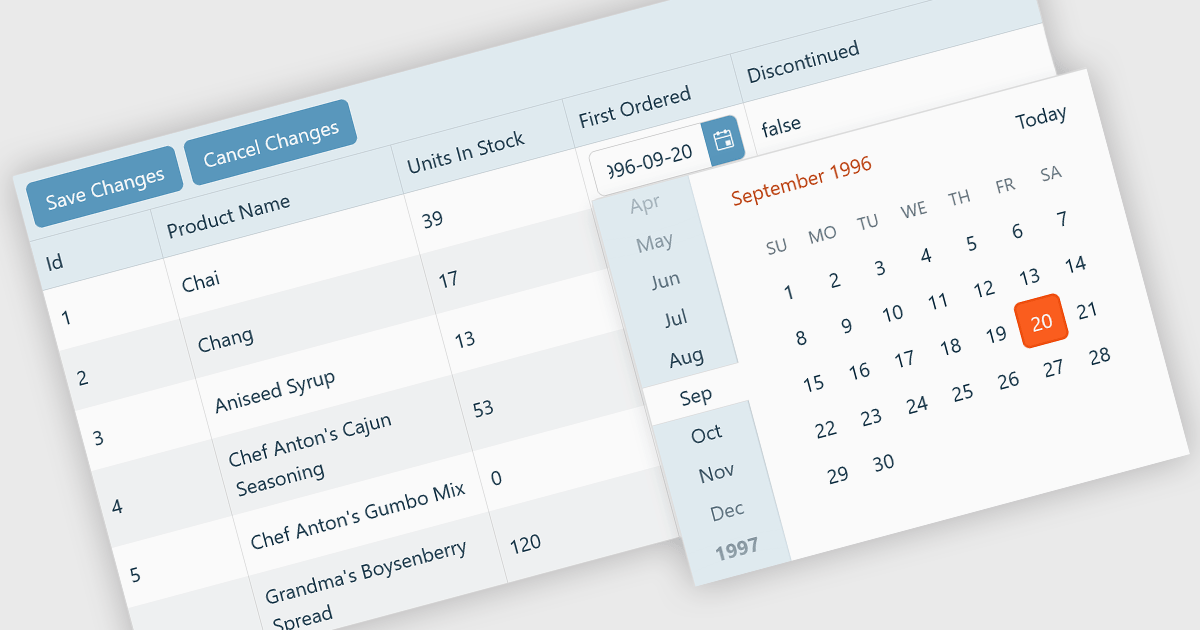
A custom grid editor allows developers to tailor how users interact with data directly within grid cells, providing a flexible and efficient editing experience. Instead of relying on standard text inputs, custom editors can include dropdowns, sliders, toggles, or calendar components to match the data type. This approach not only improves data entry and validation but also enhances accuracy and user satisfaction by ensuring inputs are contextually relevant. For example, a date field might use an inline date picker, while a status column could feature a dropdown with predefined options. Ideal for data-heavy applications such as dashboards, scheduling tools, and administrative panels, custom grid editors help users to edit complex data quickly and intuitively without leaving the main interface.
Several React Grid controls offer support for custom editing including:
For an in-depth analysis of features and price, visit our comparison of React Grid controls.
DevCraft by Telerik is a comprehensive suite of more than 1,250 UI components and development tools designed for building modern web, desktop, and mobile applications using .NET and JavaScript frameworks. It includes reporting and report management solutions, automated testing and mocking tools, and document processing libraries, as well as a wide range of professionally designed user interface controls from the Telerik and Kendo UI suites. DevCraft enables developers to create feature-rich, high-performance applications with consistent design and user experience, delivering enterprise-level, scalable, and maintainable software solutions.
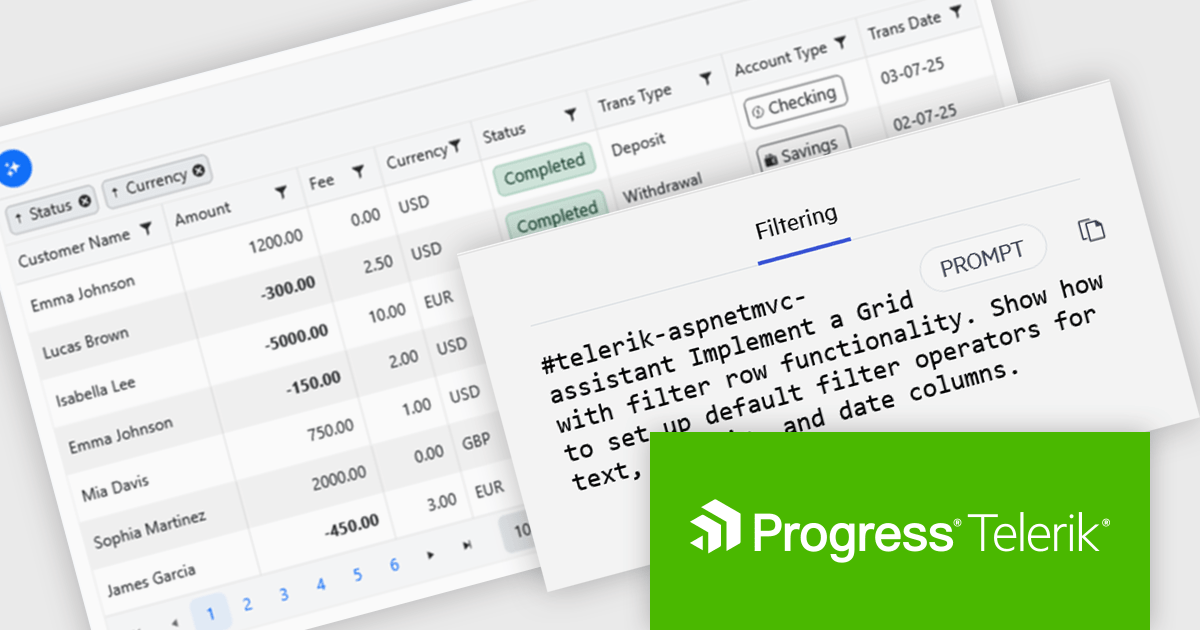
The Telerik DevCraft 2025 Q3 update introduces new AI Coding Assistants for Telerik UI for ASP.NET MVC and Kendo UI for jQuery, designed to improve developer efficiency through intelligent, context-aware code generation within supported IDEs. These assistants automate repetitive coding tasks, generate accurate framework-specific code, and deliver instant access to relevant API documentation and technical insights. By understanding the structure and capabilities of Telerik and Kendo UI components, the AI Coding Assistants enable developers to produce cleaner, more consistent code while reducing time spent on setup, configuration, and troubleshooting.
To see a full list of what's new in version 2025 Q3 (2025.3.1002), see our release notes for Telerik UI for ASP.NET MVC and Kendo UI for jQuery.
Telerik DevCraft is licensed per developer and has two licensing models: an annual Subscription License and a Perpetual License. The Subscription license provides access to the latest product updates, technical support, and exclusive benefits for a flat annual fee, and must be renewed to continue using the software. The Perpetual license is a one-time purchase granting access to the current released version and includes a one-year subscription for product updates and technical support. After this initial period, users can choose to renew the subscription element to continue receiving updates and support; otherwise, they may continue using the installed version available during their active subscription term but will forgo future updates and support. See our Telerik DevCraft Ultimate licensing page for full details.
Telerik DevCraft is available in the following editions:
電話: (888) 850 9911
Fax: +1 770 250 6199


