


公式サプライヤー
公式および認定ディストリビューターとして200社以上の開発元から正規ライセンスを直接ご提供いたします。
当社のすべてのブランドをご覧ください。
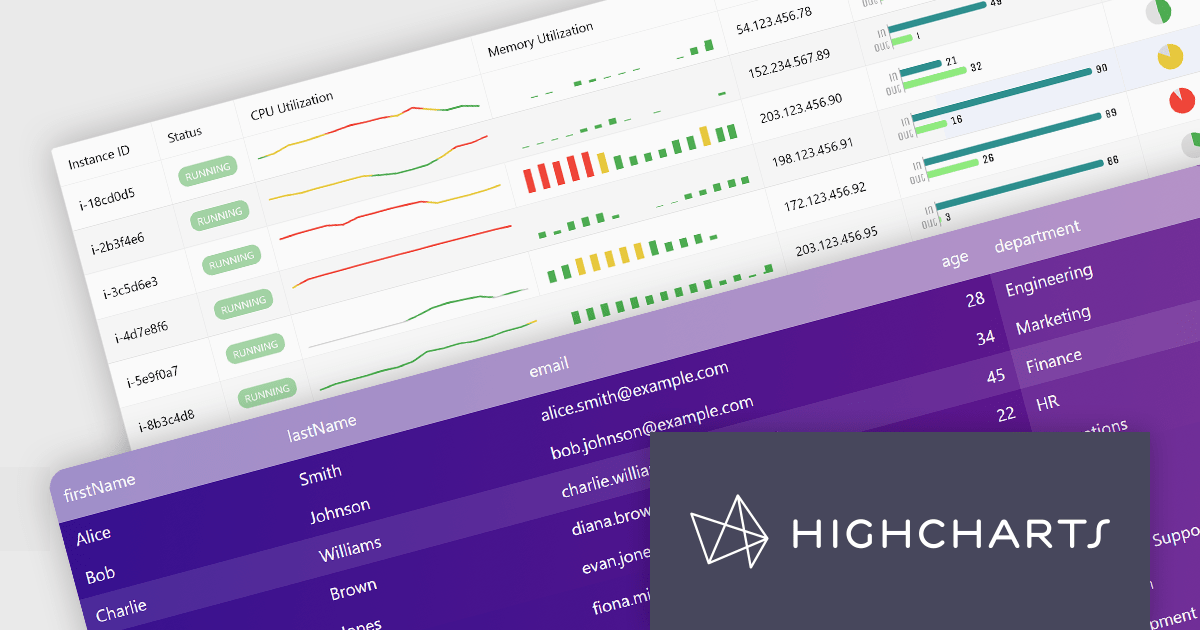
Highcharts Grid Pro is a versatile data grid component developed by the creators of Highcharts, offering both standalone functionality and tight integration within the Highcharts and Highcharts Dashboards ecosystems. It features advanced capabilities such as real-time data binding, column sorting, filtering, inline editing, pagination, and data export, enabling users to work with structured data efficiently. Designed to complement Highcharts' visual components, Grid Pro allows for seamless alignment between data tables and interactive charts when used together, but it can also function independently in applications that require only tabular data interaction. This makes it ideal for a wide range of use cases, including financial platforms, business intelligence tools, and any application where users need to view, edit, and interact with complex datasets directly in the browser.
Highcharts Grid Pro is now available as a standalone component. The v2.0 update delivers a set of professional-grade enhancements focused on improving usability, data control, and visual clarity. It introduces interactive editing with built-in editors for text, numbers, and dates, making in-grid updates more intuitive. Configurable validation rules ensure data accuracy, while embedded sparklines, powered by Highcharts Core, provide immediate visual insights alongside the data. Features such as pagination, column filtering, and sorting make it easier to manage and explore large datasets. Developers can also implement custom behaviors and event hooks to align the grid with specific application needs.
For a limited time you can benefit from special introductory pricing!
Save 50% off new licenses of Highcharts Grid Pro or Highcharts Dashboards when bought individually or when combined in a bundle with other products from Highsoft including Highcharts Core, Stock, Maps and Gantt.
Highcharts Grid Pro is licensed per developer as an Annual or Perpetual License with Internal, Saas, SaaS+ and OEM distribution options. The annual license includes support and all product updates for 1 year and must be renewed to continue to use the software. The perpetual license includes an "Advantage Subscription" which provides support and updates for a set period of time. If you do not renew Advantage then you may continue to use the software at the last release available during the active Advantage period. See our Highcharts Grid Pro licensing page for full details.
Learn more on our Highcharts Grid Pro product page.
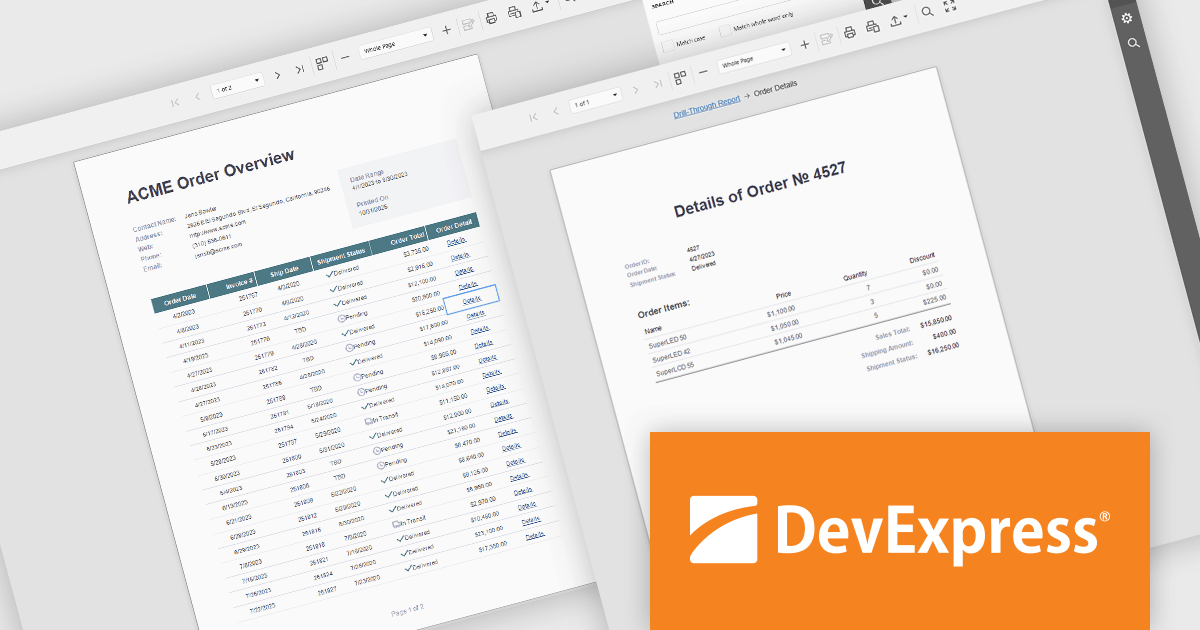
DevExpress Reporting is a comprehensive suite of reporting tools that help developers create visually stunning and highly customizable reports for various applications. With its rich feature set, including data binding, layout design, printing, and exporting capabilities, DevExpress Reporting enables the efficient creation of reports that meet the most demanding business requirements.
DevExpress Reporting enhances data analysis by enabling drill-through reports, allowing developers to create interactive report designs that link summary-level data to detailed information. This feature provides a streamlined way for users to explore data hierarchies without leaving the main report, improving usability and workflow efficiency. By clicking on data points, users can view related details in a connected report, ensuring a cohesive and intuitive data exploration experience. This capability helps developers deliver more dynamic, context-rich reporting solutions that support faster and more informed decision-making.
DevExpress Reporting is licensed per developer and is available as a Perpetual License with a 12 month support and maintenance subscription. See our DevExpress Reporting licensing page for full details.
DevExpress Reporting is available to buy in the following products:
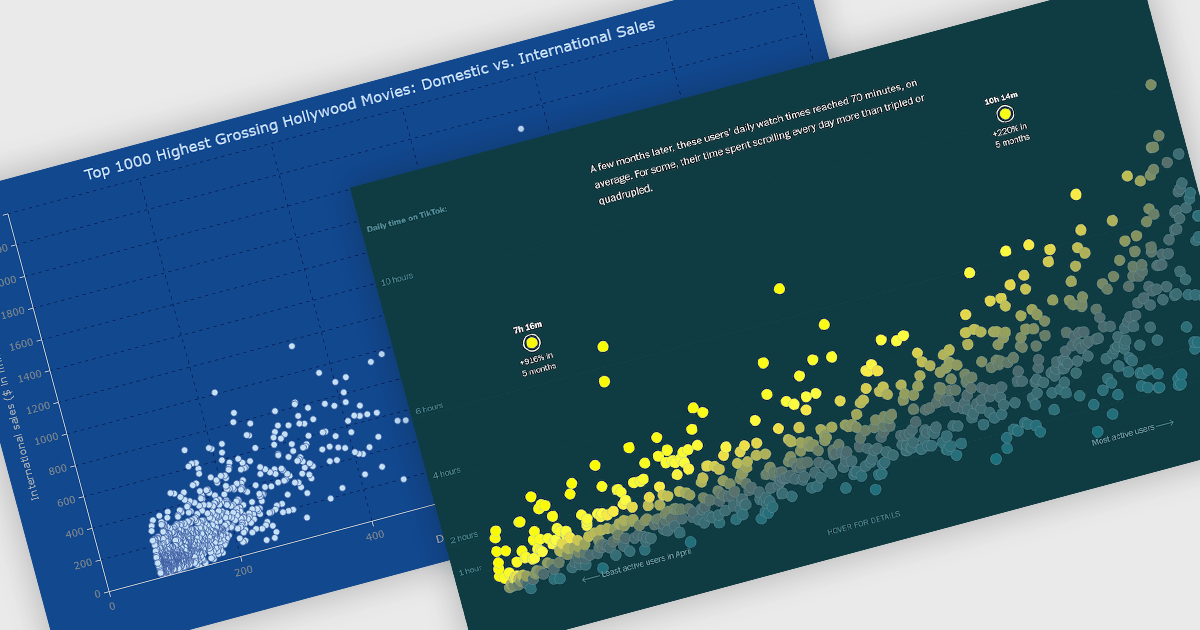
A scatter chart is a visual tool that displays relationships between two variables by plotting data points on an X and Y axis. Each point represents a value pair, helping users quickly identify patterns, correlations, and outliers within complex datasets. Scatter charts effectively highlight trends, clusters, and anomalies that might not be visible in tables. With customizable markers, colors, and sizes, they clearly differentiate data groups. Common use cases include analyzing sales versus marketing spend, comparing temperature and energy use, or assessing customer satisfaction relative to pricing. This turns raw data into clear and actionable visual insights.
Several JavaScript chart controls offer scatter charts including:
For an in-depth analysis of features and price, visit our JavaScript chart controls comparison.
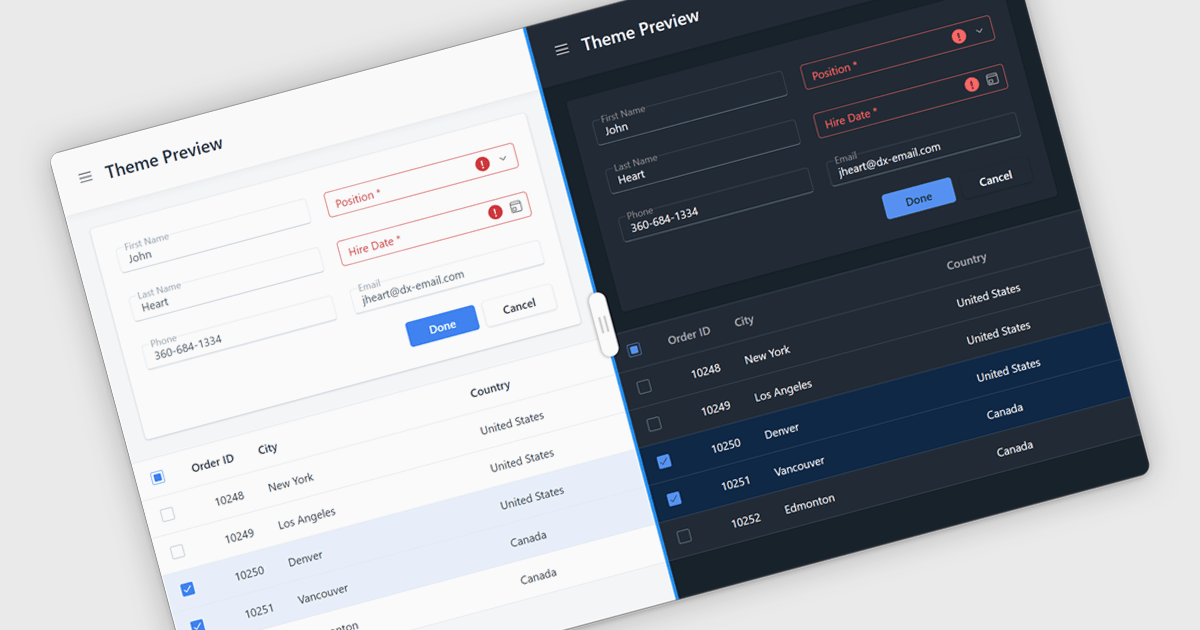
UI suite theming allows developers and designers to define a unified visual style across all components. By controlling colors, typography, spacing, and other design elements from a central configuration, teams can ensure consistency, maintain brand identity, and improve updates. Theming also enables effortless customization, allowing teams to align a product’s look with branding, support light and dark modes, or adapt interfaces for different clients. This approach accelerates development and enhances user experience, making applications feel polished, cohesive, and professional. Common use cases include enterprise dashboards, multi-brand SaaS platforms, and cross-platform applications that require a consistent appearance on web, desktop, and mobile.
Several JavaScript UI suites offer theming support, including:
For an in-depth analysis of features and price, visit our comparison of JavaScript UI suites.
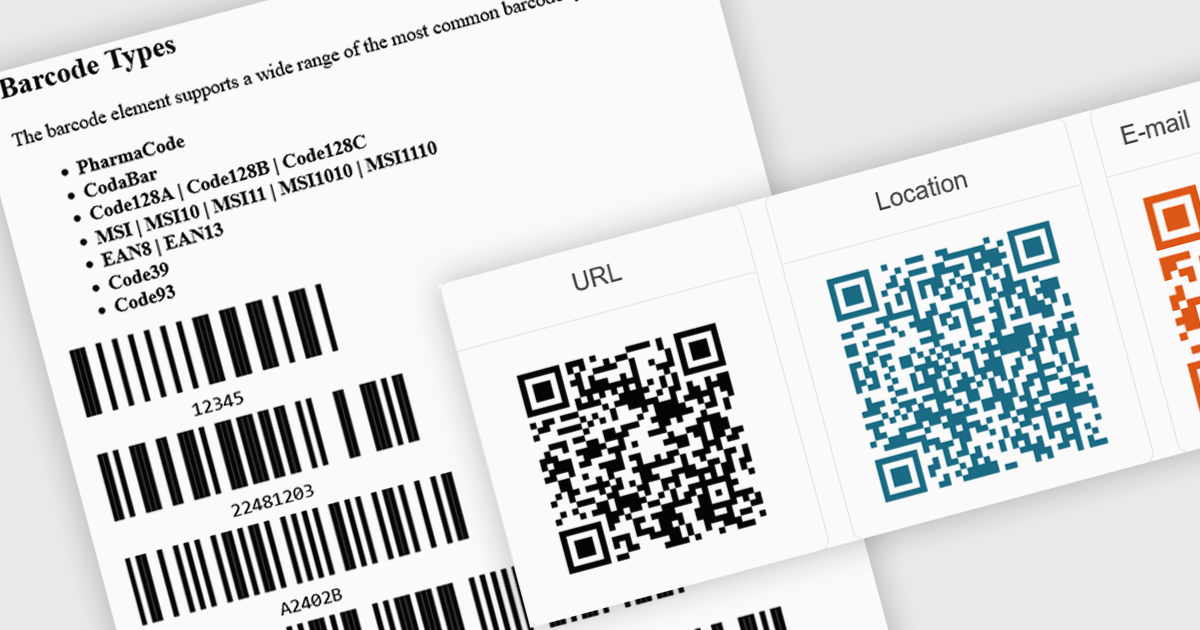
Barcode support in an Angular UI suite refers to built-in components that allow developers to generate and display barcodes directly within their applications. This capability simplifies the integration of barcode-based workflows, such as inventory tracking, product labeling, or user identification, without relying on third-party libraries. By handling various barcode standards and formats natively, these components ensure consistency in rendering and decoding, reduce development time, and enhance application performance and reliability when working with barcode data.
Several Angular UI suites provide barcode controls, including:
For an in-depth analysis of features and price, visit our comparison of Angular UI Suites.
電話: (888) 850 9911
Fax: +1 770 250 6199


