


公式サプライヤー
公式および認定ディストリビューターとして200社以上の開発元から正規ライセンスを直接ご提供いたします。
当社のすべてのブランドをご覧ください。
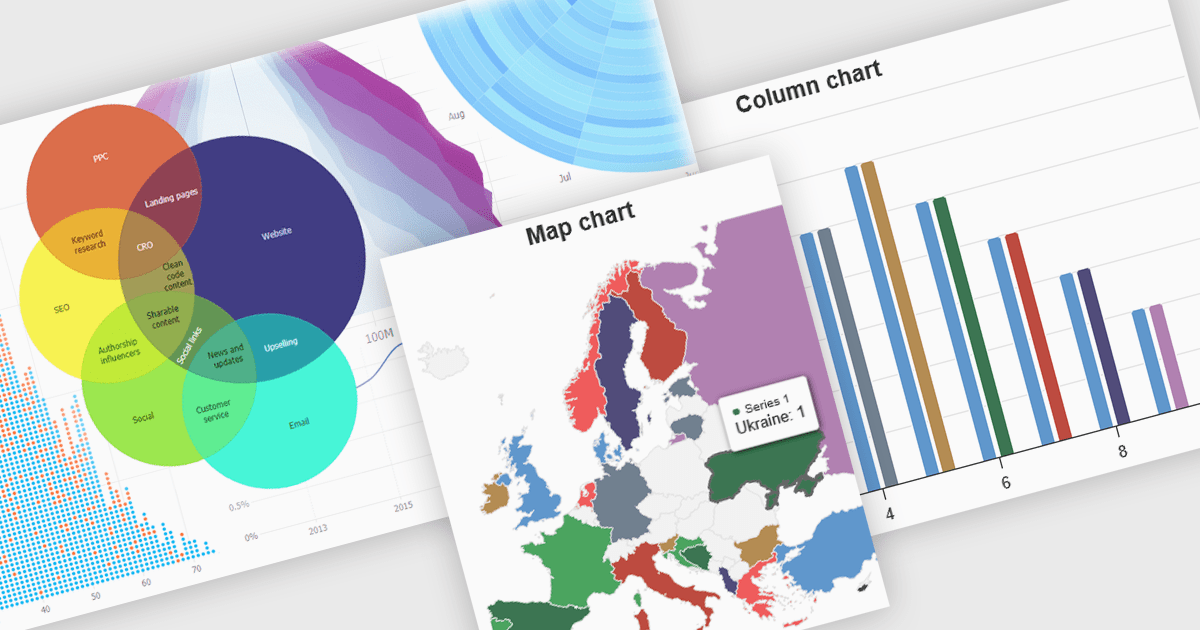
High contrast charts use distinct and contrasting color palettes within data visualizations to improve clarity, particularly for individuals with visual impairments. This involves choosing colors with noticeably different hues and brightness for elements such as lines, bars, labels, and backgrounds, so that differences in data are easy to spot. These charts improve data understanding, make information accessible to more people, reduce eye strain for some users, and support accessibility standards. They are useful in many areas, such as financial reports, scientific papers and public health dashboards that must be clear and designed for a everyone regardless of visual ability.
Several JavaScript charting components provide accessible high contrast features, including:
For an in-depth analysis of features and price, visit our JavaScript chart components comparison.
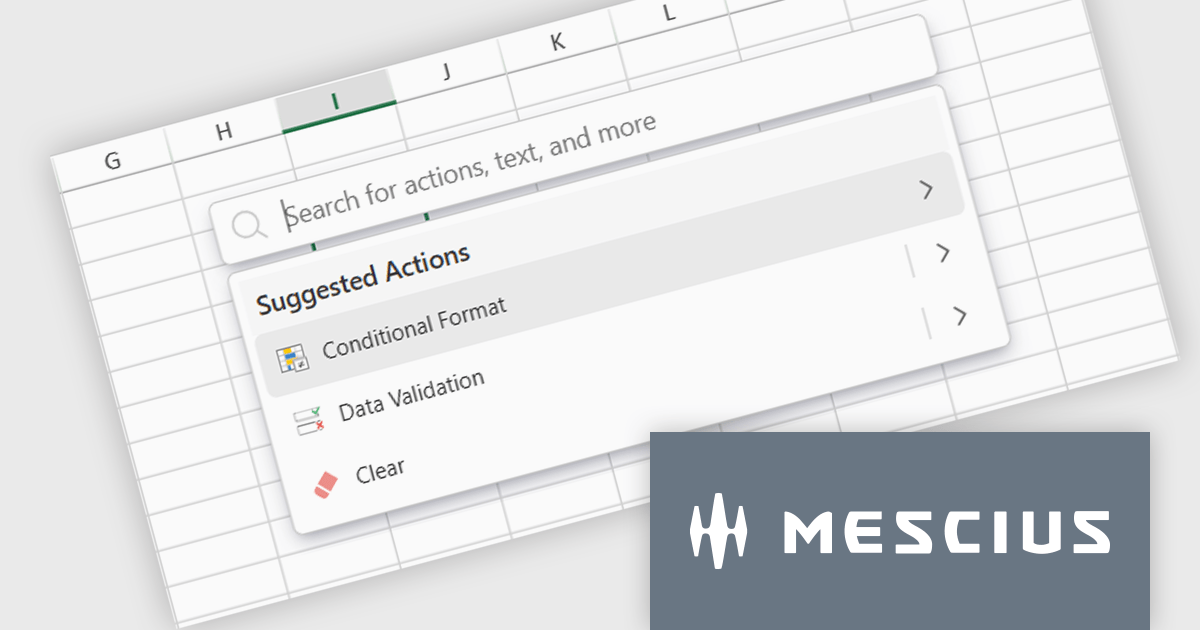
SpreadJS is a high-performance JavaScript spreadsheet and data presentation component designed for enterprise web applications. It enables developers to deliver Excel-like functionality directly within their web solutions, providing advanced features such as data binding, complex calculations, pivot tables, charts, and extensive formatting options. Fully compatible with modern JavaScript frameworks like React, Angular, and Vue, SpreadJS allows seamless integration and customization, empowering development teams to create interactive, data-driven user experiences without relying on external spreadsheet applications.
The SpreadJS 18.1.0 update introduces the new Command Palette, providing developers with a centralized interface to quickly access and execute a wide range of spreadsheet commands without navigating through complex menus. This enhancement improves productivity by reducing the time required to locate functions, allowing developers to apply formatting, manage data, and configure worksheet settings directly through intuitive search and selection capabilities. The Command Palette can be instantly triggered using the familiar Ctrl/Cmd + P keyboard shortcuts, offering quick access to commands and further accelerating common development and data manipulation tasks within the application.
To see a full list of what's new in 18.1.0, see our release notes.
SpreadJS is licensed per developer and includes 1 Year Maintenance (major and minor version releases and unlimited support phone calls). SpreadJS requires an Annual or Perpetual Deployment License. The optional Add-ons are available at an additional cost, and require a SpreadJS license. See our SpreadJS licensing page for full details.
For more information, visit our SpreadJS product page.
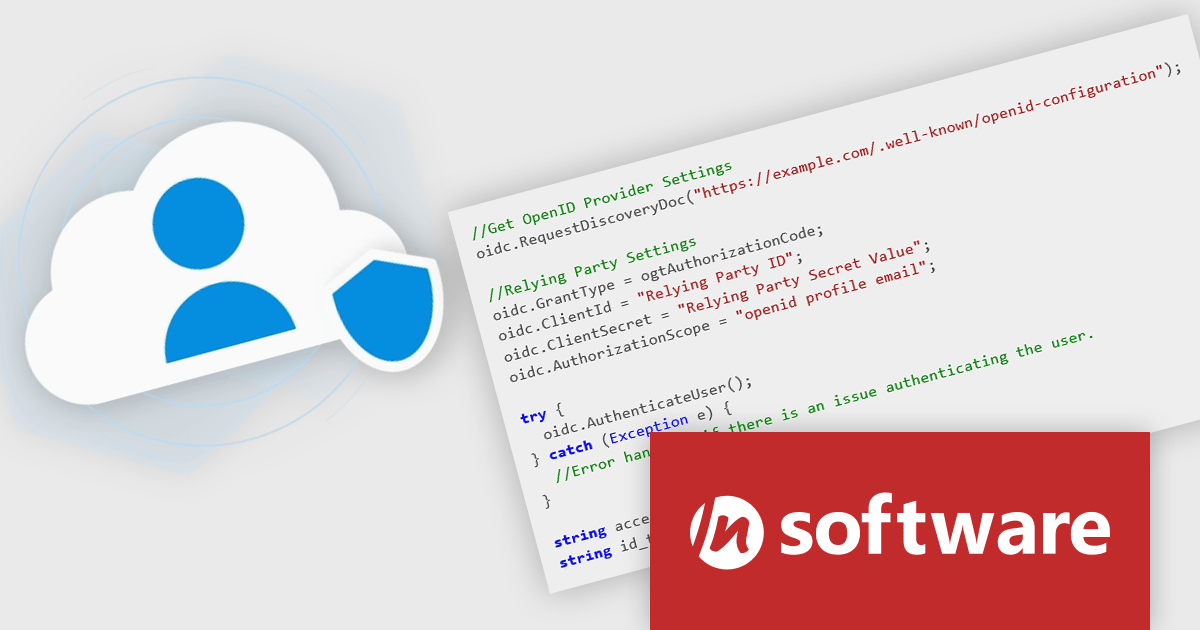
Cloud SSO, a new product in the Red Carpet Subscription Vol. 2 2025 update, dramatically simplifies the implementation of Single Sign-On (SSO) in modern applications. By supporting widely adopted standards like SAML (Security Assertion Markup Language) and OpenID Connect, this toolkit ensures seamless integration with virtually any major identity provider - including Microsoft, Google, Apple, GitHub, GitLab, Okta, and others. Developers can now enable centralized authentication without writing custom code for each provider, making it easier to build secure, scalable, and user-friendly login flows across cloud, mobile, and desktop applications.
To see a full list of what's new in Red Carpet Subscription Vol. 2 2025, see our release notes.
Red Carpet Subscription is licensed per developer and is available as a Perpetual License with a 12 month support and maintenance subscription. See our Red Carpet Subscription licensing page for full details.
For more information, visit our /n software Red Carpet Subscription product page.

ComponentSource's expertise and global reach have significantly expanded the worldwide accessibility of FusionCharts' data visualization solutions. By leveraging ComponentSource's established distribution network and multilingual support, FusionCharts has connected with a broader international audience of developers and organizations across diverse industries and geographical locations, enabling them to enhance their applications with compelling data insights.
This 5 year partnership between ComponentSource and FusionCharts reflects a shared dedication to empowering developers with best-in-class tools, acknowledging the role of effective data visualization in modern applications. Through this partnership, ComponentSource has played a key role in making FusionCharts flagship product FusionCharts Suite XT more accessible to a global audience.
Now marking 5 years of working together, ComponentSource and FusionCharts are continuing to build on their collaboration. As demand grows for tools that help developers deliver more data-driven and visually rich applications, the partnership remains focused on improving access and simplifying procurement for teams everywhere.
As we celebrate this milestone, we look forward to strengthening our partnership and continuing to provide developers with the tools they need to succeed.
For more information, visit our FusionCharts brand page.
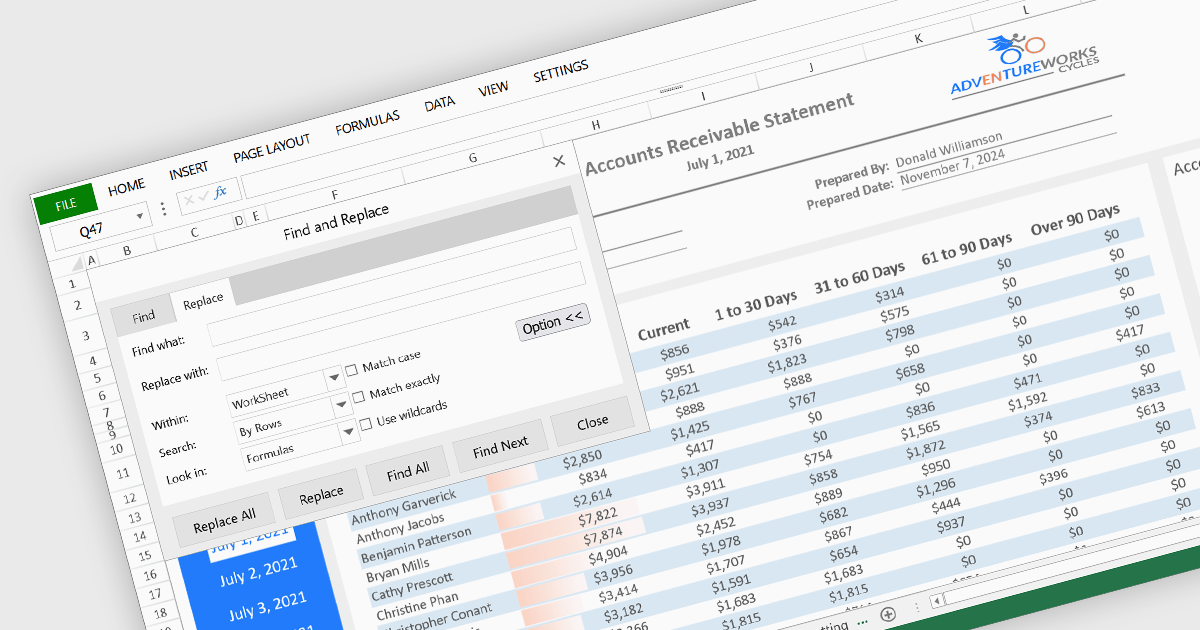
Find and replace functionality in a spreadsheet application enables users to quickly search for specific text, numbers, or characters within a worksheet and substitute them with alternative content. Often including advanced options such as case sensitivity, regular expressions, and the ability to target specific sheets or cell ranges, this feature lets users make consistent updates across large datasets without manually editing each cell. By automating these repetitive tasks, it reduces the risk of human error and significantly enhances productivity and accuracy in data processing. It is particularly useful for correcting errors, updating outdated information, or standardizing entries, such as changing all instances of an old product name to a new one.
Several JavaScript spreadsheet controls offer find and replace functionality, including:
For an in-depth analysis of features and price, visit our comparison of JavaScript spreadsheet controls.
電話: (888) 850 9911
Fax: +1 770 250 6199


