


公式サプライヤー
公式および認定ディストリビューターとして200社以上の開発元から正規ライセンスを直接ご提供いたします。
当社のすべてのブランドをご覧ください。
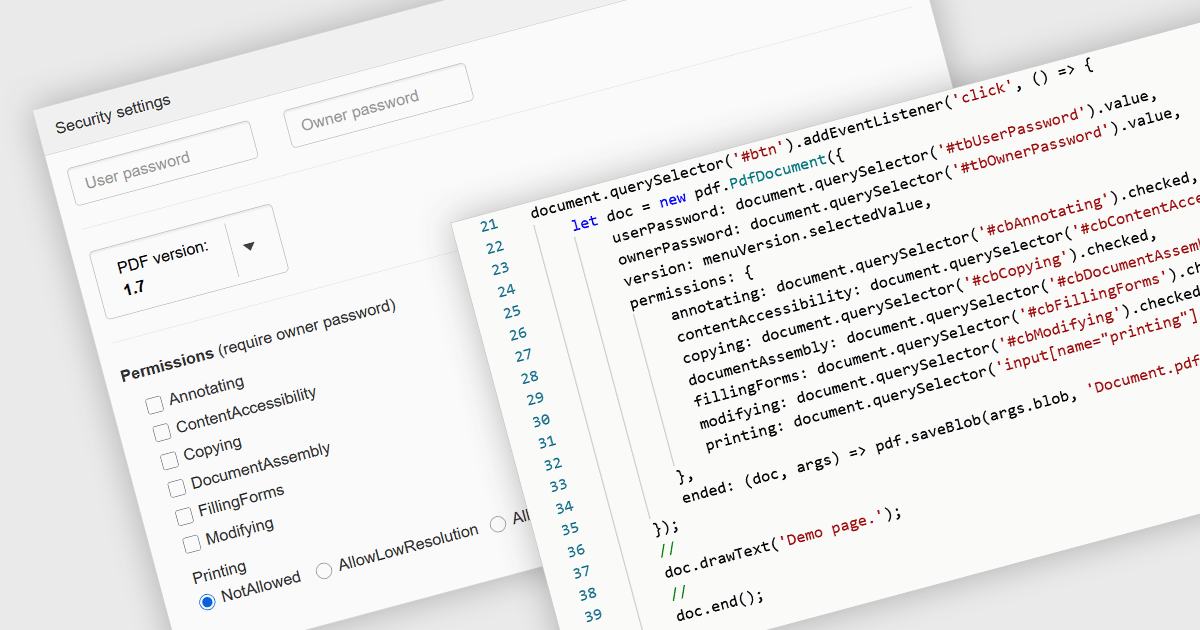
PDF password protection is a security feature that restricts access to the PDF file by requiring a password to open, modify, print or copy its contents. By setting either an open password (to prevent unauthorized viewing) or a permissions password (to control actions such as editing or printing), this mechanism ensures that document owners can safeguard sensitive information against unauthorized access or tampering. This is particularly useful in professional and legal contexts where data confidentiality and document integrity are critical, helping to maintain compliance with privacy standards and internal data protection policies.
Several JavaScript PDF components allow you to protect PDFs with passwords, including:
For an in-depth analysis of features and price, visit our comparison of JavaScript PDF components.
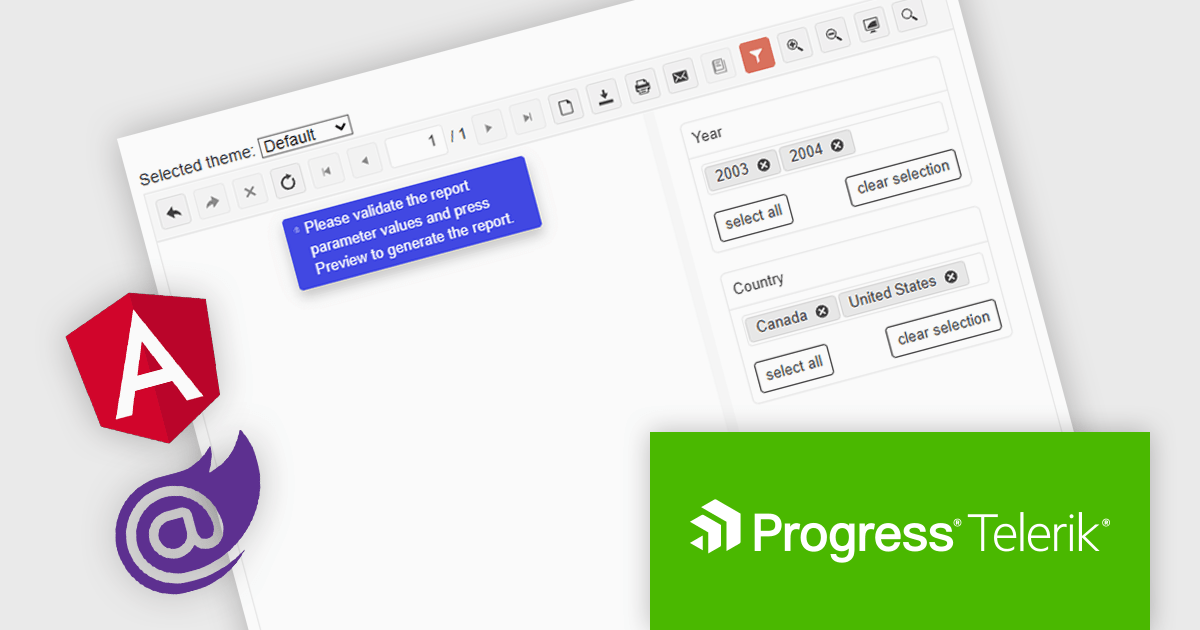
Telerik Reporting is a comprehensive and lightweight embedded reporting tool for .NET web and desktop applications. It enables developers and reporting users to create, design, and export visually appealing, interactive, and reusable reports to effectively present analytical and business data. It supports various technologies, including ASP.NET Core, Blazor, ASP.NET MVC, ASP.NET AJAX, HTML5/JS, Angular, WPF, WinForms, and WinUI.
The Telerik Reporting 2025 Q1 update introduces user-initiated initial report preview in the native Blazor and Angular viewers, giving developers greater control over how and when reports are rendered. Instead of automatically generating reports on viewer load, this feature allows end users to manually trigger the preview process. This improvement helps reduce unnecessary data processing and improves application performance, particularly in scenarios involving large datasets or complex report logic. It also supports more efficient resource management on both the client and server sides, enabling developers to create faster, more responsive, and user-friendly reporting experiences.
To see a full list of what's new in 2025 Q1 (19.0.25.211), see our release notes.
Telerik Reporting is licensed per developer and has two licensing models: an annual Subscription License and a Perpetual License. The Subscription license provides access to the latest product updates, technical support, and exclusive benefits for a flat annual fee, and must be renewed to continue using the software. The Perpetual license is a one-time purchase granting access to the current released version and includes a one-year subscription for product updates and technical support. After this initial period, users can choose to renew the subscription element to continue receiving updates and support; otherwise, they may continue using the installed version available during their active subscription term but will forgo future updates and support. See our Telerik Reporting licensing page for full details.
Telerik Reporting is available to buy in the following products:
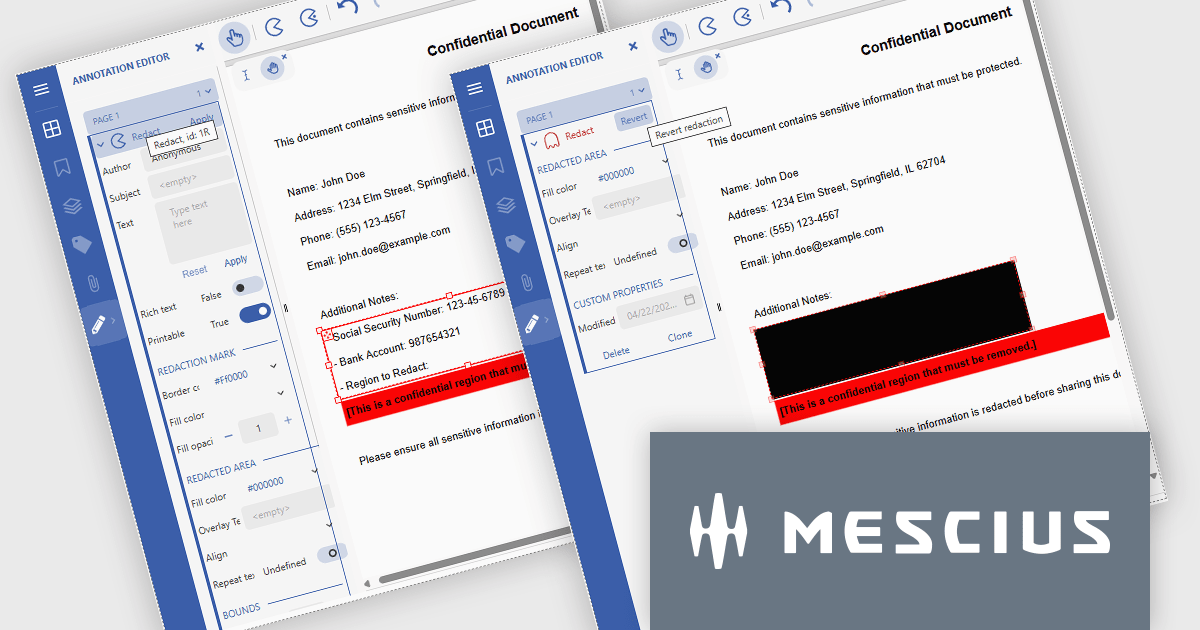
Document Solutions for PDF (DsPdf) by MESCIUS is a software development toolkit that provides .NET Core libraries and a JavaScript PDF viewer for manipulating and displaying PDFs. DsPdf enables developers to create, edit, annotate, and redact PDF documents directly within web applications. The included DsPdfViewer component offers a feature-rich, cross-platform solution for viewing and interacting with PDFs in modern browsers on various operating systems, including mobile devices.
The Document Solutions for PDF v8.1 update introduces robust redaction capabilities to the DsPdfViewer/Wasm, allowing users to add, edit, and apply redact annotations directly within the browser - without the need for a .NET server. This feature, available through the Professional DsPdfViewer license with WebAssembly (Wasm) SupportApi, ensures sensitive information can be securely removed or hidden with ease, enhancing compliance and document control in client-side PDF workflows.
To see a full list of what's new in version 8.1.0, see our release notes.
Document Solutions for PDF is licensed per developer and is available in several license options for differing distribution needs. Team licenses are also available for multiple developers within the same organization. See our Document Solutions for PDF licensing page for full details.
Document Solutions for PDF is available to buy individually or as part of Document Solutions .NET Bundle.
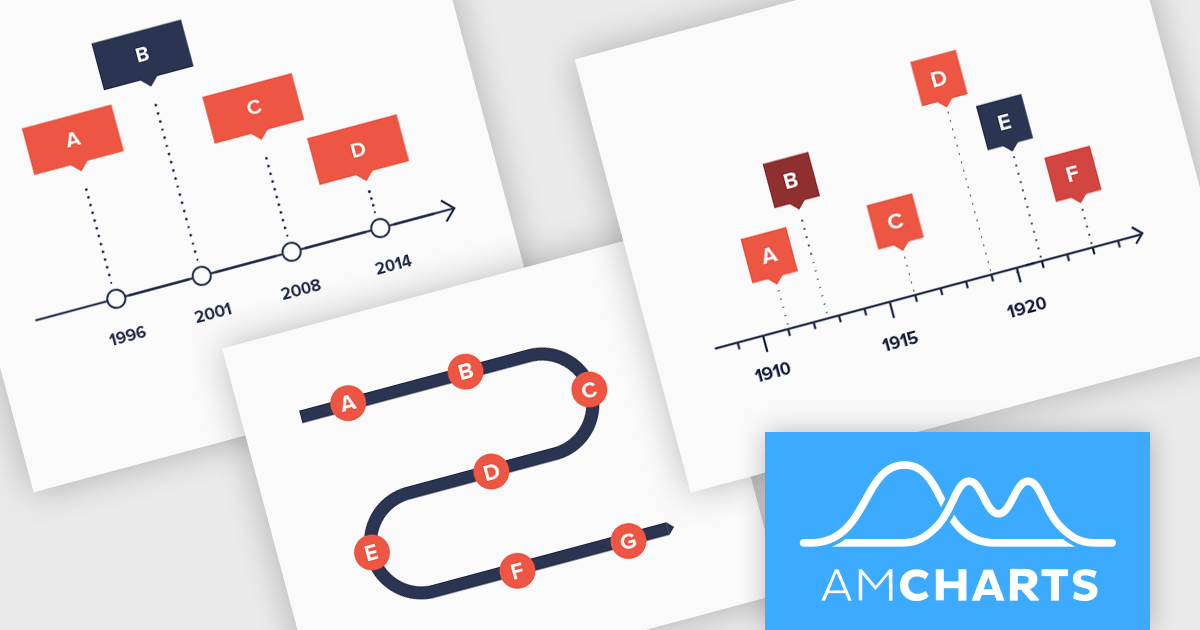
amCharts: Charts is a versatile and user-friendly JavaScript library designed for seamless data visualization across a wide range of applications. This ready-made solution helps users to integrate interactive charts without the need to learn complex new technologies. Featuring built-in support for TypeScript and ES6 modules, amCharts: Charts offers full compatibility with popular front-end frameworks such as Angular, React, and Vue.js. Its flexibility and ease of use make it an ideal choice for developers seeking a powerful yet simple drop-in solution to create engaging and informative data visualizations for dashboards and data analytics.
The amCharts 5.12.0 update introduces a new Timeline chart type, providing developers with a specialized component for visualizing linear datasets in a space-efficient manner. This chart facilitates the creation of two-dimensional plots that can be rendered along serpentine, spiral, or fully customized paths. By deviating from traditional linear axes, the Timeline chart offers a unique approach to presenting chronological or sequential data, potentially enhancing user engagement and providing alternative perspectives on data distribution without requiring complex configurations beyond standard XY chart principles. This new chart type inherits core functionalities from existing XY charts, ensuring a familiar development experience while offering a distinct visual representation option.
To see a full list of what's new in amCharts 5: Charts (version 5.12.0), see our release notes.
amCharts is licensed per developer on an annual or perpetual basis, with options for websites, SaaS and OEM distribution. See our amCharts 5: Charts licensing page for full details.
For more information, visit our amCharts 5: Charts product page.
Syncfusion Essential Studio JavaScript is a comprehensive UI library offering over 80 high-performance, lightweight, and responsive components to transform your web apps. Built from scratch with TypeScript, it boasts modularity and touch-friendliness, letting you pick and choose specific features while ensuring smooth mobile interaction. With rich themes, global accessibility features, and extensive documentation, it powers everything from basic buttons to interactive charts and data grids, simplifying frontend development across JavaScript, Angular, React, and Vue.
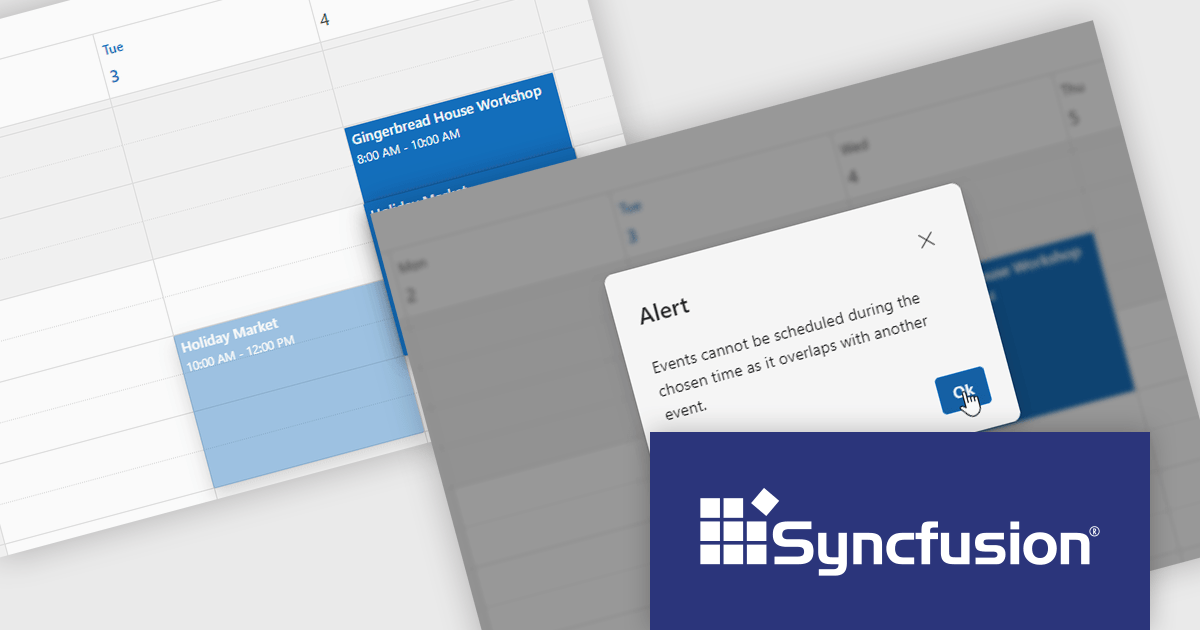
The Syncfusion Essential Studio JavaScript 2025 Volume 1 release adds a new feature to the Scheduler component to prevent overlapping appointments by setting the allowOverlap property to false. This enhancement ensures that users cannot schedule multiple events at the same time slot, thereby maintaining a clear and organized calendar.
To see a full list of what's new in 2025 Volume 1, see our release notes.
Syncfusion Essential Studio JavaScript is available as part of Syncfusion Essential Studio Enterprise which is licensed per developer starting with a Team License of up to five developers. It is available as a 12 Month Timed Subscription License which includes support and maintenance. See our Syncfusion Essential Studio Enterprise licensing page for full details.
Learn more on our Syncfusion Essential Studio JavaScript product page.
電話: (888) 850 9911
Fax: +1 770 250 6199


