













公式サプライヤー
公式および認定ディストリビューターとして200社以上の開発元から正規ライセンスを直接ご提供いたします。
当社のすべてのブランドをご覧ください。
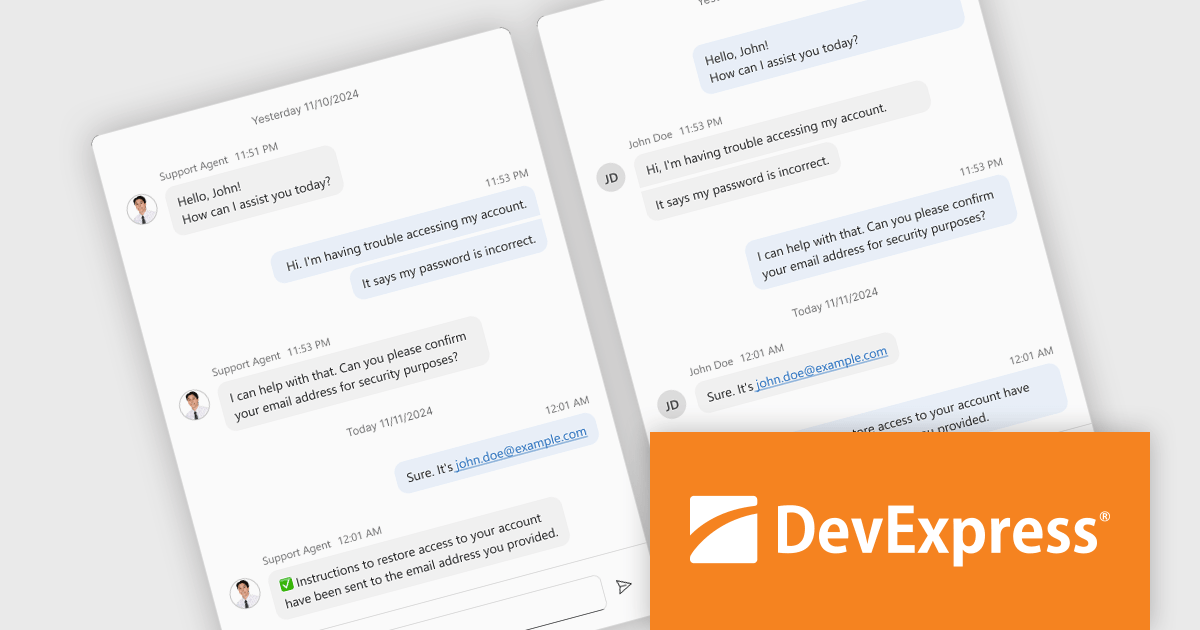
DevExtreme Complete is a robust suite of tools by DevExpress designed to streamline the development of high-performance web applications. It includes a wide range of UI components for modern frameworks such as Angular, React, Vue, and jQuery, making it ideal for developers aiming to create responsive, cross-platform applications with ease. With features like rich data visualization, interactive grids, form controls, and adaptive layouts, it empowers developers to deliver polished and user-friendly interfaces. Whether you're building enterprise dashboards or consumer-facing apps, DevExtreme Complete provides the flexibility and power to meet complex requirements while maintaining performance and usability.
The DevExtreme Chat Component (v24.2) introduces a versatile solution for integrating instant communication into web applications. It supports one-on-one and group interactions, AI and chatbot connectivity for intelligent support, and extensive customization options to create tailored user experiences. With features like typing indicators, popup integration, accessibility compliance, and internationalization, it offers a flexible and inclusive communication platform suitable for a wide range of scenarios, from customer support to team collaboration.
To see a full list of what's new in version 24.2, see our release notes.
DevExtreme Complete is licensed per developer and is available as a Perpetual License with a 12 month support and maintenance subscription. See our DevExtreme Complete licensing page for full details.
DevExtreme Complete is available to buy individually or as part of the following products:
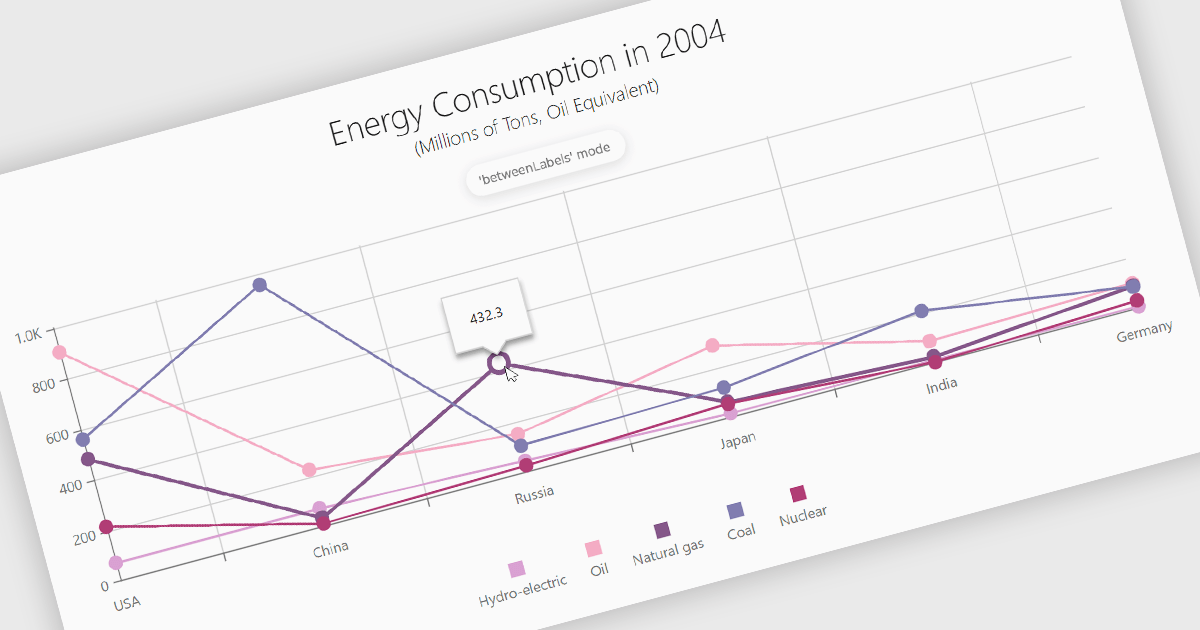
Line charts are a fundamental data visualization tool used to represent quantitative values over a continuous interval, such as time, by connecting data points with straight lines. They are particularly effective for analyzing trends, comparing multiple data sets, and identifying relationships or patterns within large or complex datasets. For software developers, line charts provide a clear and efficient way to present dynamic data, support interactive features for deeper analysis, and enhance decision-making by making critical insights easily accessible through a customizable and intuitive format.
Several Angular chart controls offer line charts including:
For an in-depth analysis of features and price, visit our comparison of Angular Charts.
Effective January 6, 2025, Highcharts has streamlined its licensing model to enhance clarity, simplify compliance, and improve the overall user experience. The updates include unified definitions, revised license grants, and an upgraded ADV+ support offering.
Streamlined Definitions
The terms “SaaS application” and “web application” have been replaced with a unified term: "External Application". This new terminology clarifies the distinction between applications covered under the Internal License and those requiring additional licensing.
Updated License Grants
Public websites, previously covered under the Internal License grant, are now under the SaaS License grant. This ensures consistency across applications for public access.
Video Call Support for ADV+ Subscribers
Users subscribed to the Highcharts Advantage Plus (ADV+) tier now benefit from video call support, providing more robust communication options for troubleshooting and guidance.
For existing customers using the Internal License to deploy on public websites, these updates reclassify such use under the SaaS License grant. The updated Highsoft license terms mean that customers currently using an Internal License for an external Public Web site or for an “External Application” will need to upgrade to a SaaS License to ensure compliance. For more information see our updated Highcharts Core licensing page.
If you have questions about Highcharts licensing, our experts are here to assist. Whether you need guidance on selecting the right license, moving to a new agreement, or ensuring compliance, we’re ready to help via toll-free phone, live chat or email.
Wijmo by MESCIUS is a comprehensive suite of JavaScript UI components designed for building high-performance, enterprise-grade applications. With its lightweight, modular architecture, Wijmo provides developers with a rich set of tools, including data grids, charts, input controls, and advanced features such as PivotGrid and FinancialChart. Optimized for modern frameworks like React, Angular, and Vue, Wijmo offers seamless integration, flexibility, and extensive customization options.
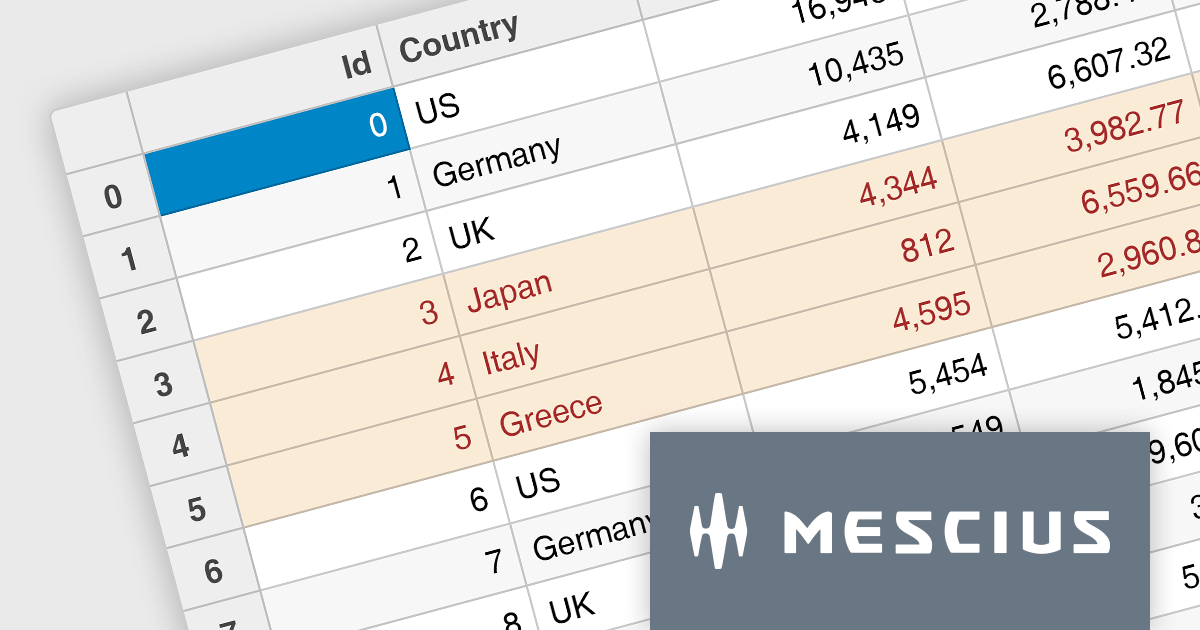
The Wijmo 2024 v2 Build 5.20242.30 update introduces a new API for cell styling in FlexGrid, providing developers with greater control and precision in customizing grid appearance. This enhancement allows developers to dynamically apply styles at the cell level based on data or state, ensuring a tailored and context-aware presentation of grid content. The API streamlines the process of defining and managing styles, reducing complexity and enabling cleaner, more maintainable code. By leveraging this capability, developers can create visually engaging and functionally responsive grids that align with specific application requirements, enhancing both user experience and application performance.
To see a full list of what's new in 2024 v2 Build 5.20242.30, see our release notes.
Wijmo is licensed per developer. Developer licenses are perpetual and include 1 year subscription which provides upgrades, including bug fixes and new features. See our Wijmo licensing page for full details.
Learn more on our Wijmo product page.
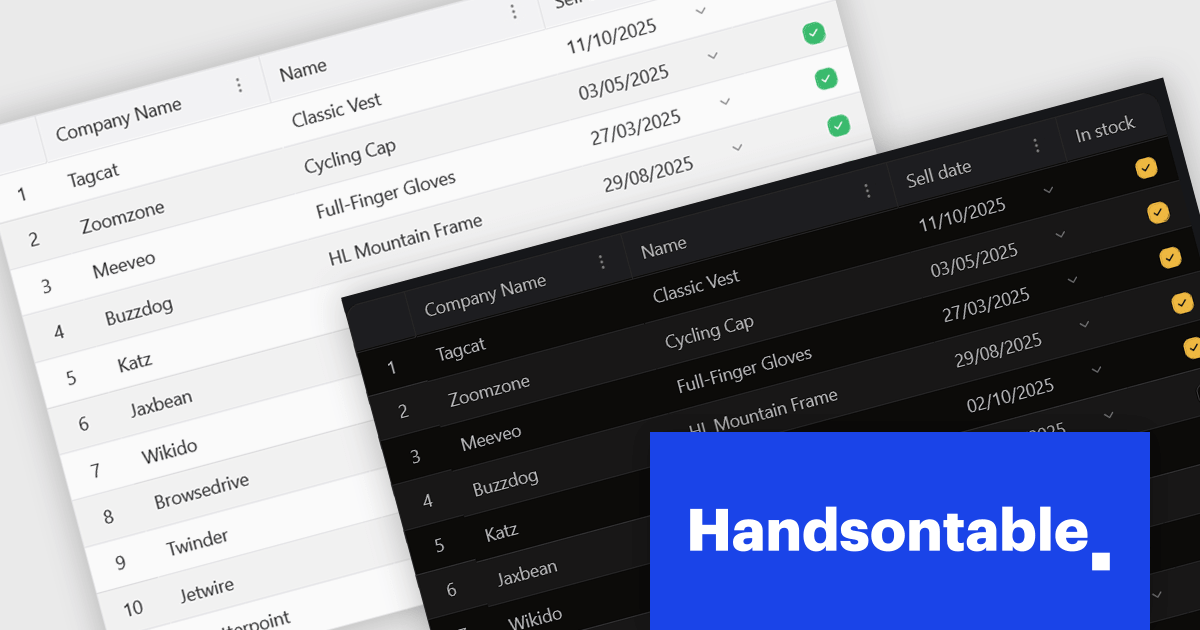
Handsontable is a JavaScript library designed to help developers build interactive data grids into their web applications. Offering a familiar spreadsheet-like interface, it allows users to edit, sort, and filter data with ease. Highly customizable and compatible with popular frameworks like React and Angular, Handsontable empowers developers to build robust data manipulation features into their web applications.
The 15.0.0 release introduces a significant enhancement in terms of styling flexibility. The underlying CSS framework has been entirely overhauled, granting developers unprecedented control over the visual presentation of their grids. This update boasts a comprehensive library of over 180 CSS variables, allowing for meticulous customization of every visual aspect. From subtle adjustments to font sizes and colors to more radical transformations of borders, cell padding, and overall layout, users can seamlessly align the table's appearance with their specific design preferences and branding guidelines. This level of granular control empowers designers and developers to create truly unique and visually compelling data tables that seamlessly integrate with their existing user interfaces.
To see a full list of what's new in version 15.0.0, see our release notes.
Handsontable is licensed per developer and is available as an Annual or Perpetual license with 1 year support and maintenance. See our Handsontable licensing page for full details.
For more information, visit our Handsontable product page.
電話: (888) 850 9911
Fax: +1 770 250 6199


