


公式サプライヤー
公式および認定ディストリビューターとして200社以上の開発元から正規ライセンスを直接ご提供いたします。
当社のすべてのブランドをご覧ください。
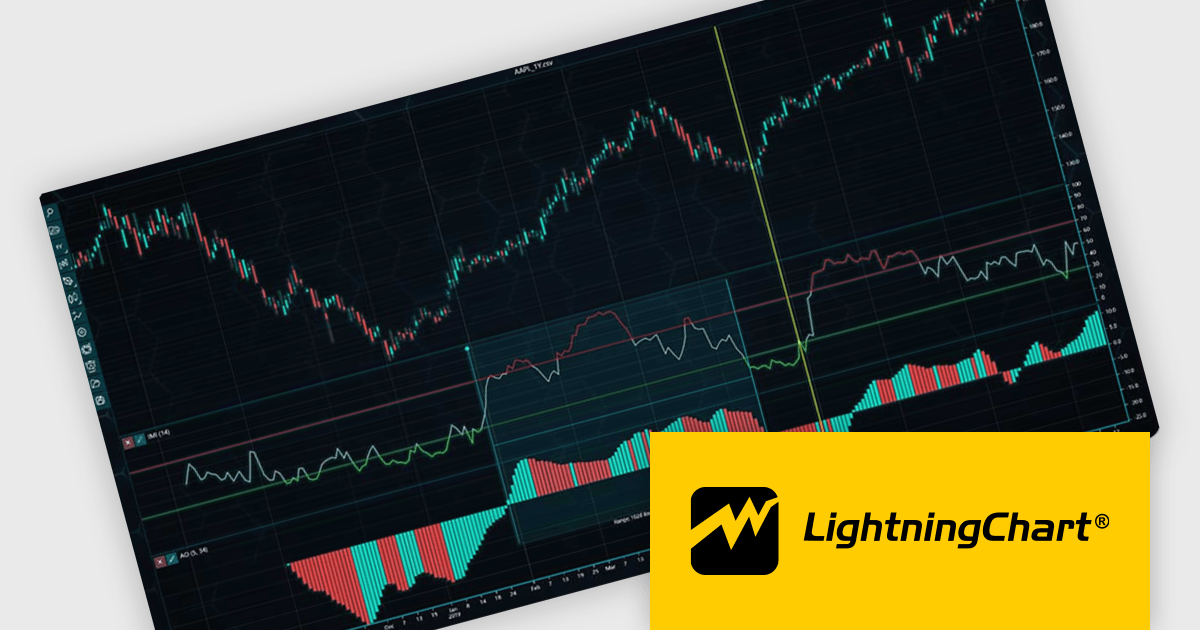
LightningChart JS Trader is a JavaScript/TypeScript library developed by LightningChart that specifically targets the creation of financial and trading applications. It provides high-performance, 2D, 3D, and real-time charting controls and a comprehensive suite of visualizations including candlestick, bar, line, and various technical indicators and drawing tools. This library enables software developers to craft interactive technical analysis tools without the need for server-side setup as it runs completely on the client device.
The LightningChart JS Trader v3 update introduces draggable splitter lines, enabling users to dynamically resize indicator segments and the main chart within a single view. This enhancement provides greater flexibility in data visualization, allowing developers to create a more customizable and user-friendly charting experience. By adjusting the layout interactively, users can allocate space efficiently based on analytical needs, improving readability and workflow efficiency. This update eliminates the need for separate charts, streamlining technical analysis and ensuring all relevant data remains accessible within a unified interface.
To see a full list of what's new in v3, see our release notes.
LightningChart JS Trader is licensed per developer and is available as an annual license with 1 year support. See our LightningChart JS Trader licensing page for full details.
For more information, see our LightningChart JS Trader product page.
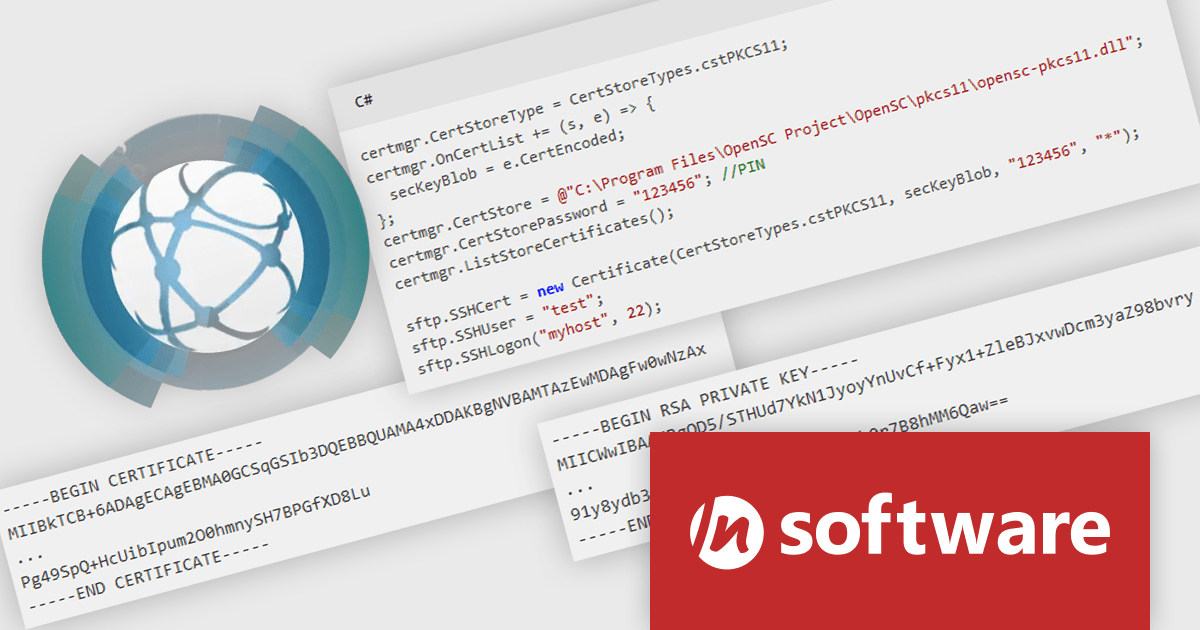
IPWorks by /n software is a comprehensive development library designed to streamline your creation of internet-enabled applications. It offers pre-built, secure components for common functionalities like sending emails, transferring files, and consuming web services. This allows you to focus on your application's core logic while leveraging pre-tested, robust tools for essential internet interactions.
IPWorks enhances security by providing developers with advanced tools for certificate validation, ensuring that only trusted and verified certificates are used in applications. With support for Certificate Revocation Lists (CRL) and Online Certificate Status Protocol (OCSP) methods, IPWorks enables real-time checks to confirm the validity of certificates and detect revocations, reducing the risk of compromised or untrustworthy communication endpoints. This robust validation mechanism helps protect sensitive data, prevent man-in-the-middle attacks, and maintain secure connections, making it an essential component for building reliable and secure software solutions.
IPWorks is licensed per developer and is available as a Perpetual License with a 12 month support and maintenance subscription. See our IPWorks licensing page for full details.
IPWorks is available to buy in the following products:
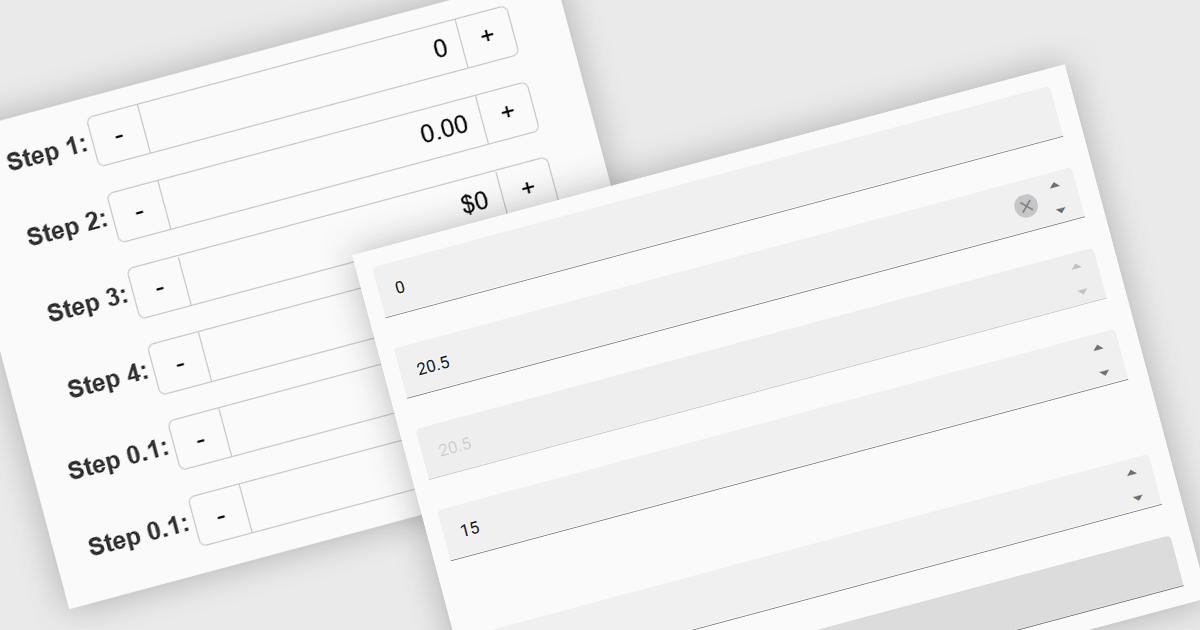
Numeric Spin data editor controls are intended for the efficient and precise input of numerical values. By combining an edit box with up/down spin buttons, users may either type to input directly or utilize the spin buttons to increase or decrease the value. This method promotes faster and less error-prone data entry than manual typing, particularly for large quantities or recurrent value revisions. Many spin editors include built-in validation, range limitations, data type selection, and formatting choices, which further improve data accuracy.
Several Vue.js data editor collections contain numeric spin components including:
For an in-depth analysis of features and price, visit our Vue.js data editors comparison.
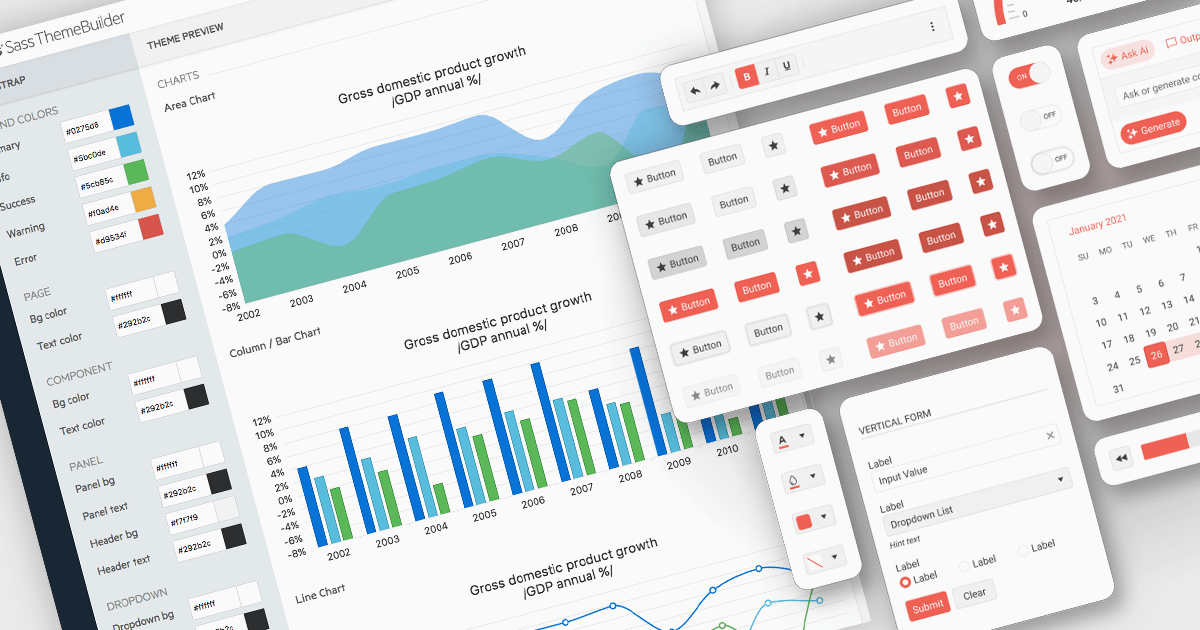
UI theming is the process of defining and applying a consistent visual style across a user interface using centralized settings for elements like colors, typography, spacing, and component styles. It allows developers to create cohesive designs that align with branding requirements, ensure cross-platform consistency, and adapt easily to user preferences or accessibility needs. By leveraging theming, software developers can streamline development workflows, reduce redundancy, and simplify maintenance while delivering customizable, scalable, and user-friendly applications.
Several React UI suites offer theming support, including:
For an in-depth analysis of features and price, visit our comparison of React UI suites.
Red Carpet Subscription by /n software is an all-inclusive developer toolkit offering a comprehensive library of development tools, network management utilities, and enterprise adapters. This subscription grants access to all products and updates, including new releases, for a flat fee per developer, streamlining your workflow and ensuring your team has the latest resources to tackle any communication or security protocol challenge.
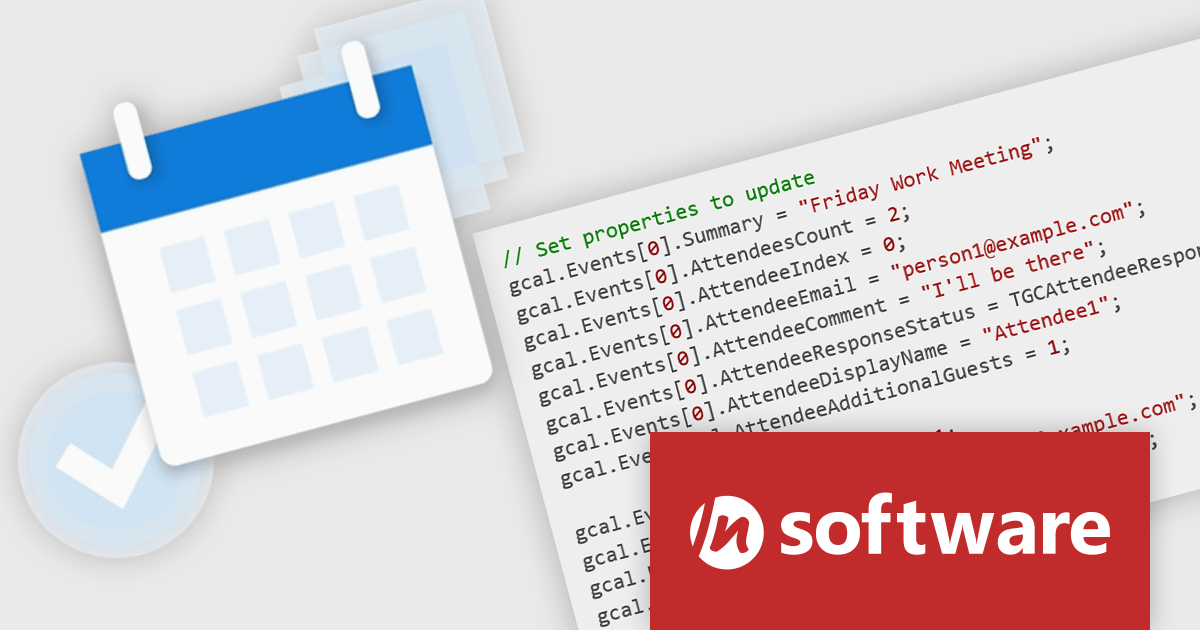
The Red Carpet Subscription Vol. 1 2025 update adds new Cloud Calendar components that integrate calendar and task management into your applications. Supporting major cloud providers like Microsoft 365 and Google, it empowers developers to easily create and manage calendars, events, coordinate attendees, and attach files. Additionally, it facilitates robust task management by enabling the creation, editing, and deletion of tasks, their organization into lists, and the tracking of their statuses. With features like calendar color customization, Cloud Calendars enhances the user experience while reducing development time and effort.
To see a full list of what's new in Red Carpet Subscription Vol. 1 2025, see our release notes.
Red Carpet Subscription is licensed per developer and is available as a Perpetual License with a 12 month support and maintenance subscription. See our Red Carpet Subscription licensing page for full details.
For more information, visit our /n software Red Carpet Subscription product page.
電話: (888) 850 9911
Fax: +1 770 250 6199


