













公式サプライヤー
公式および認定ディストリビューターとして200社以上の開発元から正規ライセンスを直接ご提供いたします。
当社のすべてのブランドをご覧ください。

Pie charts are circular diagrams that visually represent data as slices of a whole. Each slice represents a category, with its size proportional to its share of the total. They are particularly effective for illustrating categorical data, such as market shares, demographics, or budget allocations. Pie charts offer a clear and intuitive way to compare relative quantities, making it easy to identify the dominant categories and their contributions to the overall composition.
Several React chart controls offer pie charts including:
For an in-depth analysis of features and price, visit our React chart controls comparison.
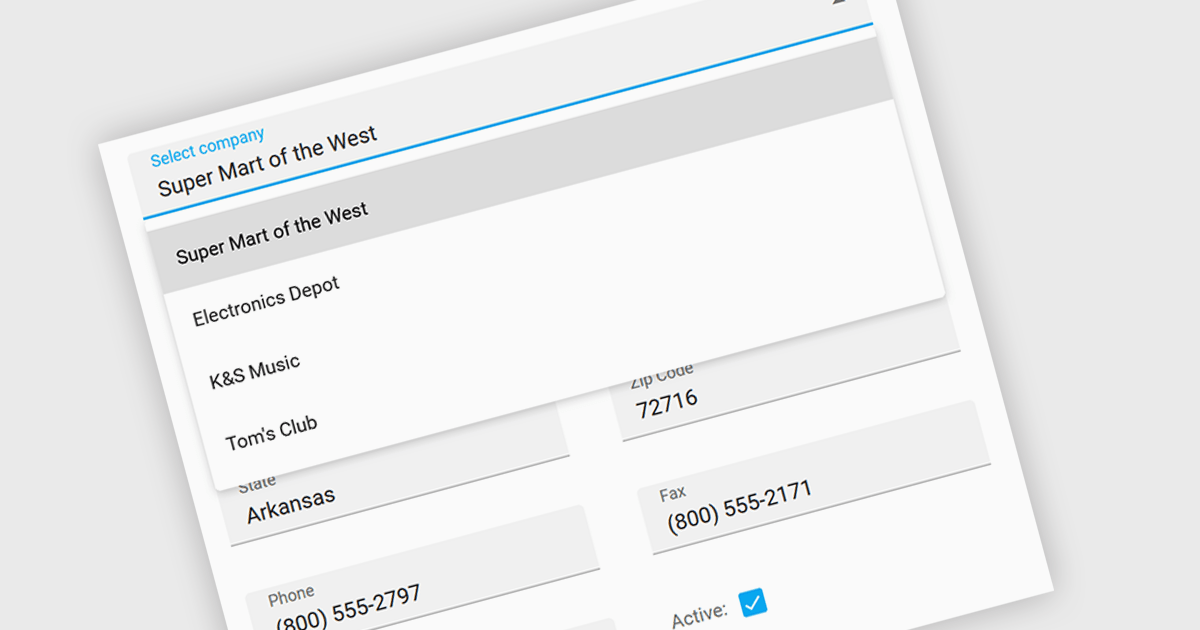
Listboxes are graphical user interface elements that display a list of items from which a user can select one or more. They are commonly used to present options, choices, or data in a compact and organized manner. Their utility lies in their ability to simplify user interaction by providing a clear and visually appealing way to navigate and choose from a predefined set of items, making them essential components in various applications, from simple forms to complex data management systems.
Several jQuery data editor collections can provide you with a listbox including:
For an in-depth analysis of features and price, visit our jQuery data editors comparison.

PrizmDoc is a comprehensive REST API platform designed to streamline the integration of secure document viewing, editing, and processing into web applications. Beyond standard features like redaction and annotation, PrizmDoc leverages advanced AI-powered tools to automate and optimize document handling processes, significantly reducing manual effort and boosting productivity. This enables businesses to enhance their document workflows, improve security, and deliver a superior user experience.
On Thursday, September 12 at 1:00 PM EST Accusoft is presenting an exciting LIve Webinar: Supercharge Your Document Workflow: Unleashing AI-powered Secure Document Processing with PrizmDoc. See how PrizmDoc's secure AI features can save valuable development time and improve the overall efficiency of document workflows by:
Register today and discover how you can harness your ECM's full potential through the power of PrizmDoc and AI.
PrizmDoc Viewer is available as Self-Hosted, Cloud-Hosted or Private Cloud-Hosted deployments. Billed on an annual subscription basis, you will need to renew your license each year to continue to use the software. The price is based on the number of servers or the number of transactions you require, depending on your deployment method. See our PrizmDoc Viewer licensing page for full details.
For more information, see our PrizmDoc Viewer product page.

Sencha Ext JS is a comprehensive JavaScript framework for building robust, data-intensive web applications. It offers a rich library of pre-built UI components, advanced data management capabilities, and tools for efficient development and testing, enabling rapid creation of cross-platform applications with high performance and a polished user experience.
Rapid Ext JS is a powerful visual development tool that simplifies the process of creating Ext JS applications. By providing a drag-and-drop interface and real-time preview capabilities, it enables developers to quickly design and build complex user interfaces without writing extensive code. The editor offers a wide range of pre-built components and templates, making it easy to create consistent and visually appealing applications. Rapid Ext JS integrates seamlessly with Visual Studio Code, providing developers with a familiar and productive development environment.
To utilize Rapid Ext JS you will need Sencha Ext JS Enterprise or Ultimate edition, available as an Annual Subscription or Perpetual License. See our Sencha Ext JS licensing page for full details.
For more information, see our Sencha Ext JS product page.

Cell image support refers to the capability of a spreadsheet component to incorporate and manipulate images directly within individual cells. This feature allows developers to visually represent data, such as charts, diagrams, or photographs, within the spreadsheet interface. By integrating images into cells, developers can enhance the overall effectiveness of their spreadsheet-based applications as well as making them more engaging for users, facilitating data visualization and analysis.
Several React spreadsheet controls offer support for cell images, including:
For an in-depth analysis of features and price, visit our React spreadsheet controls comparison.
電話: (888) 850 9911
Fax: +1 770 250 6199


