


公式サプライヤー
公式および認定ディストリビューターとして200社以上の開発元から正規ライセンスを直接ご提供いたします。
当社のすべてのブランドをご覧ください。
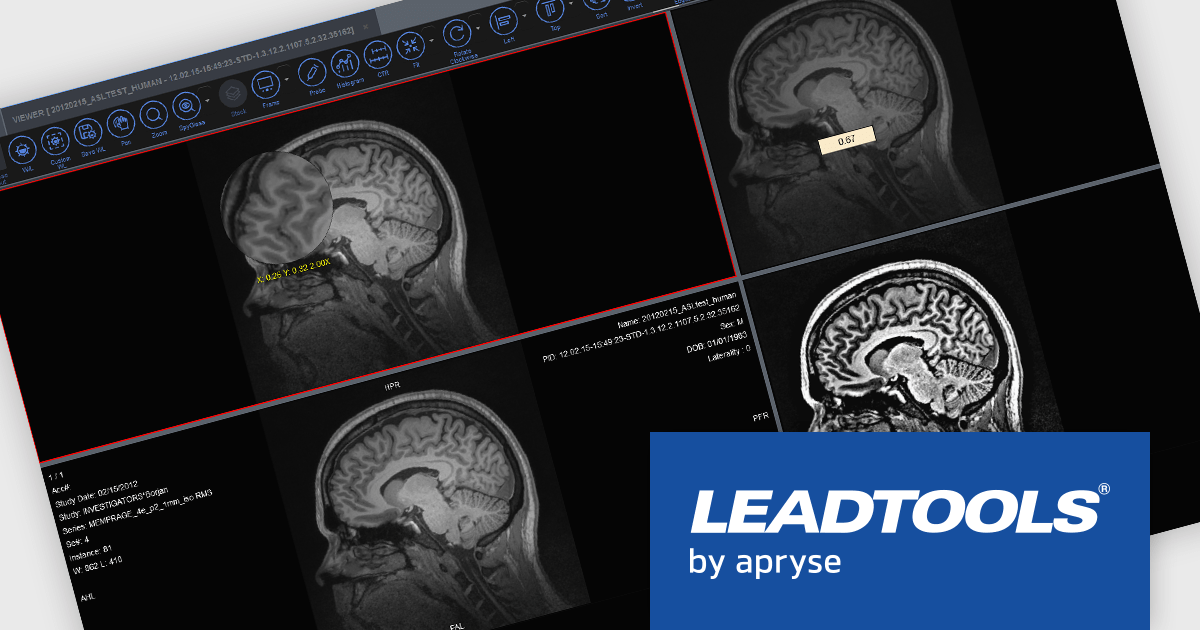
LEADTOOLS Medical SDKは、医療アプリケーションの開発を効率化するために設計されており、DICOMデータセット、8~16ビットの拡張グレースケール画像、および高度な画像注釈機能をサポートします。また、ウィンドウレベリングやLUT(ルックアップテーブル)処理などの画像表示用の専門的なツールや、医療向けの画像処理機能も含まれています。その他、可逆圧縮JPEGや符号付きおよび符号なし画像データの処理機能も備えています。Medical Imaging Suiteはこれらの機能をさらに拡張し、ウェブベースの医療画像アクセスを可能にするHTML/JavaScriptによるビューイング機能を追加しています。
LEADTOOLS Medical 3D Volume Renderingライブラリは、VRT、MIP、MPR、SSDなどの技術を用いて医療データを視覚化することを可能にします。これらのツールは、ウィンドウレベル、ズーム、密度調整のためのインタラクティブなコントロールを提供し、外観(境界線や解像度など)のカスタマイズ設定も可能です。また、3Dボリュームのキャッシュにより読み込み時間を短縮し、3D参照線や3Dカーソルを使用した同期スタックナビゲーションなどの高度な機能も備え、精密かつ効率的な医療画像処理をサポートします。
LEADTOOLS Medical SDKは、開発者がSDKを使用するための開発ライセンスと、エンドユーザー向けアプリケーション配布に必要な配布ライセンスがご用意されております。詳細情報については、 LEADTOOLS Medical(日本語)のライセンスページ をご参考ください。
詳細情報については、 LEADTOOLS Medical(日本語版)の製品ページと と LEADTOOLS Medical Suite(日本語)の製品ページをご参考ください。
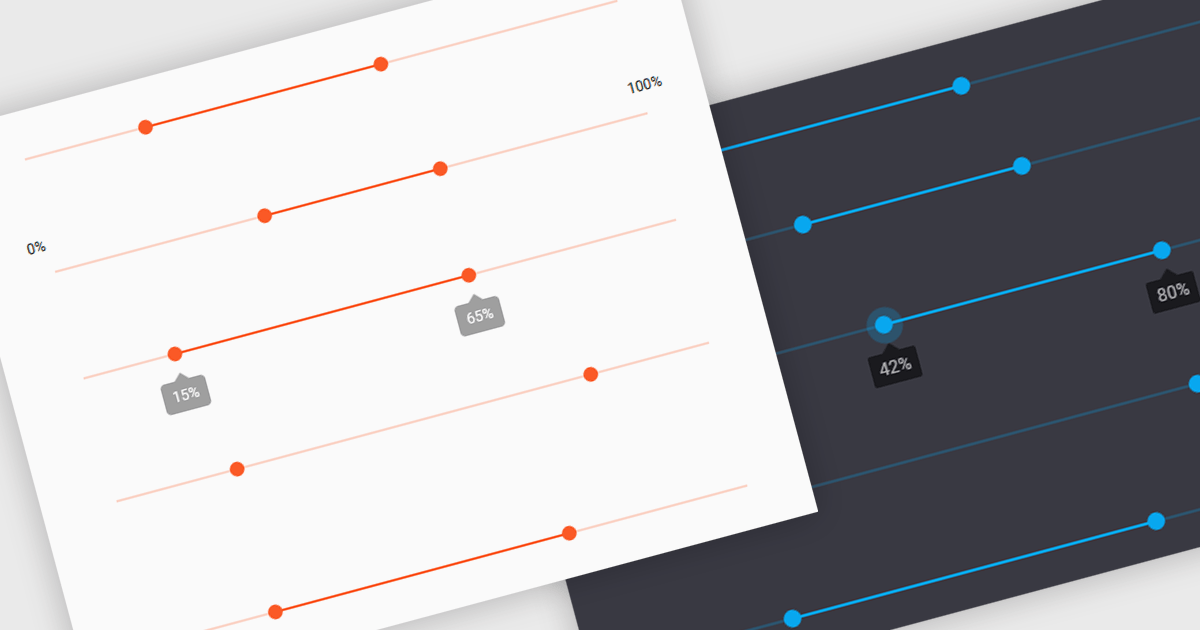
A range trackbar is a UI control that allows users to select a numeric value or a range of values within a predefined minimum and maximum. The range trackbar offers a user-friendly way to adjust values dynamically by dragging a slider, and it can be bound to data using Angular's two-way data binding. This component is particularly beneficial for scenarios where precision control over numeric input is needed, such as setting thresholds, adjusting parameters, or configuring settings, enhancing user interaction and simplifying input collection.
Several Angular Data Editor controls support range trackbars including:
For an in-depth analysis of features and price, visit our comparison of Angular Dada Editor components.
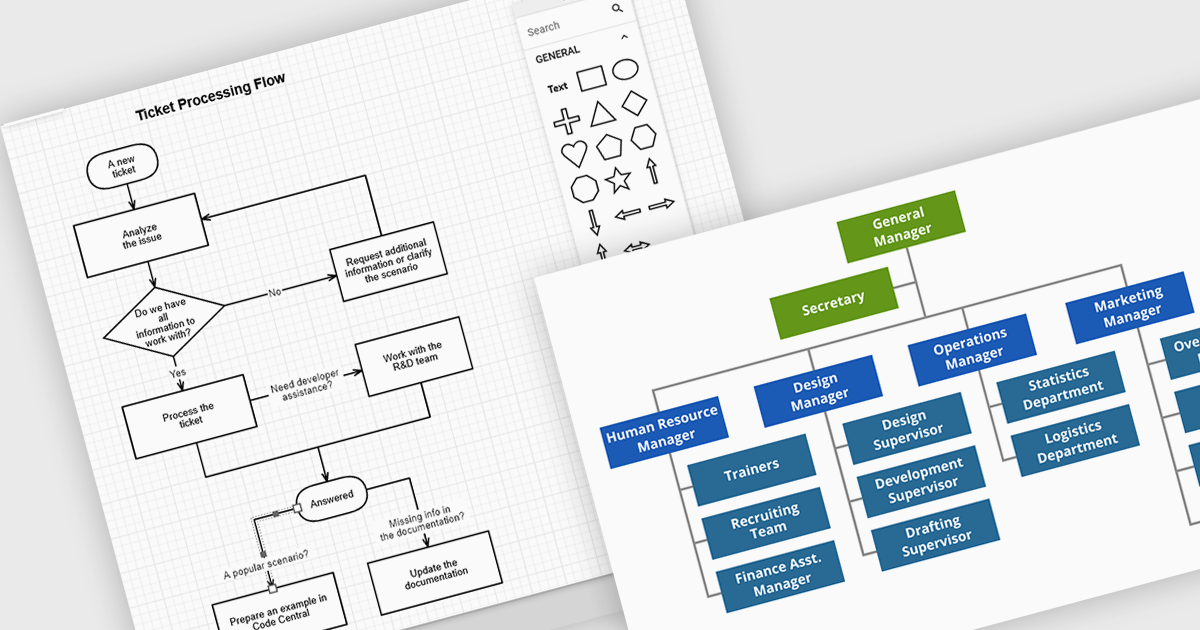
JavaScript diagramming components are libraries that enable developers to create interactive and dynamic diagrams in web applications. By offering customizable elements like nodes and connectors, they simplify the visualization of complex data, workflows, and processes. These components save development time and enhance user experience with pre-built tools for creating diagrams without the need for manual graphics handling. Common use cases include business process modeling, network architecture visualization, and organizational charts, making them ideal for applications requiring dynamic content and real-time collaboration.
Several JavaScript UI suites offer diagramming controls including:
For an in-depth analysis of features and price, visit our JavaScript UI suites comparison.
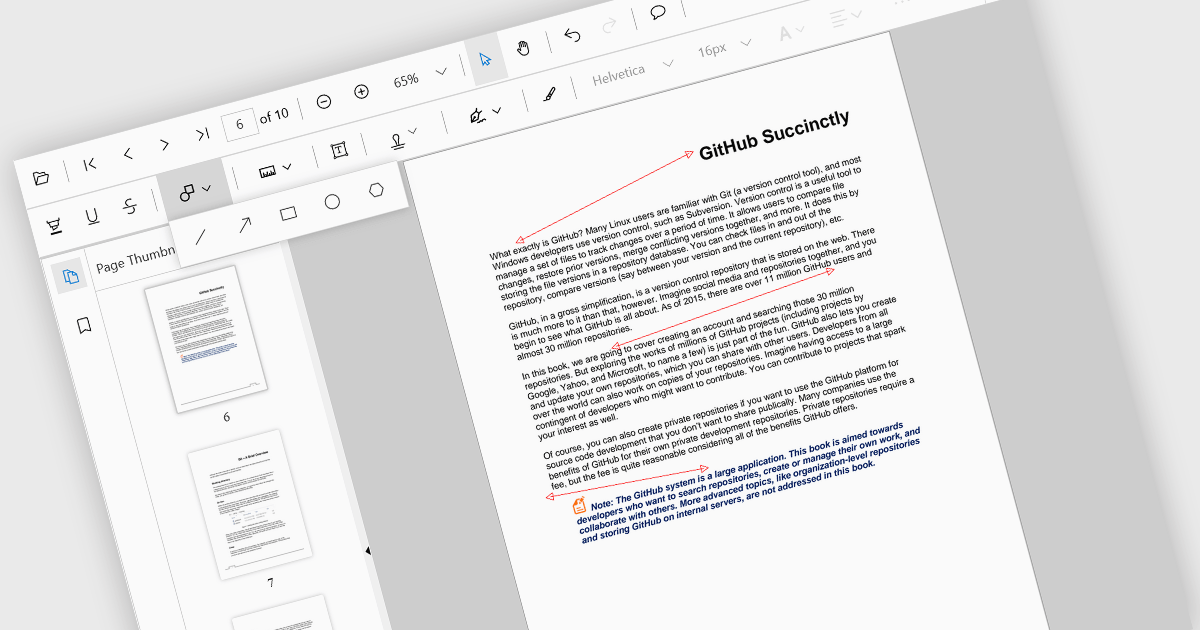
Arrow annotations are digital markings that allow users to visually indicate connections, relationships, or directions within a PDF document. They can be used to highlight specific sections, point out important details, or illustrate sequences of events. This feature is particularly valuable for collaborative work, as it enables multiple individuals to annotate the same document and share their insights effectively.
Several React PDF viewer controls offer support for arrow annotations including:
For an in-depth analysis of features and price, visit our React PDF viewer controls comparison.
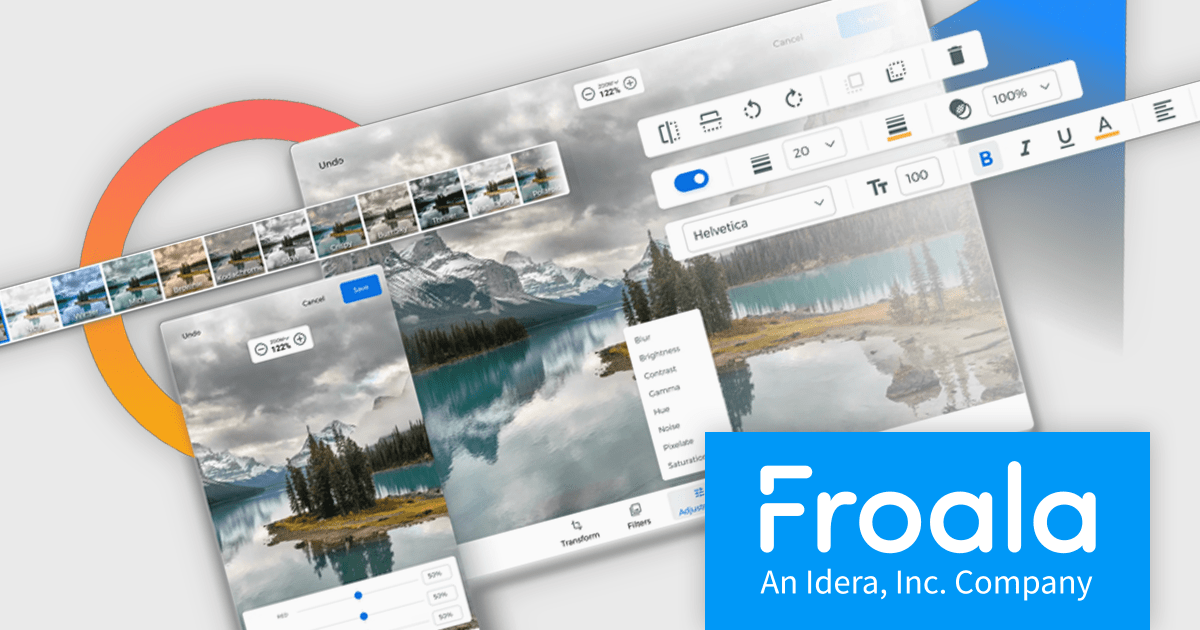
Froala Editor is a JavaScript-based WYSIWYG HTML editor that empowers developers to seamlessly integrate rich text editing functionalities into their applications.
The Froala Editor 4.3 release offers a new "Transform" button in the image editing popup, allowing users to enhance images directly within the editor. This feature allows users to apply filters, resize images, and make various other adjustments with ease. Once changes are made, the image is instantly replaced with the transformed version. This integration streamlines the editing process, offering users greater control and flexibility over their visual content without needing to leave the editor.
To see a full list of what's new in 4.3, see our release notes.
Froala Editor is licensed per product and domain. It is available as an annual or perpetual license with version upgrades and support. See our Froala Editor licensing page for full details.
For more information, visit our Froala Editor product page.
電話: (888) 850 9911
Fax: +1 770 250 6199


