


公式サプライヤー
公式および認定ディストリビューターとして200社以上の開発元から正規ライセンスを直接ご提供いたします。
当社のすべてのブランドをご覧ください。
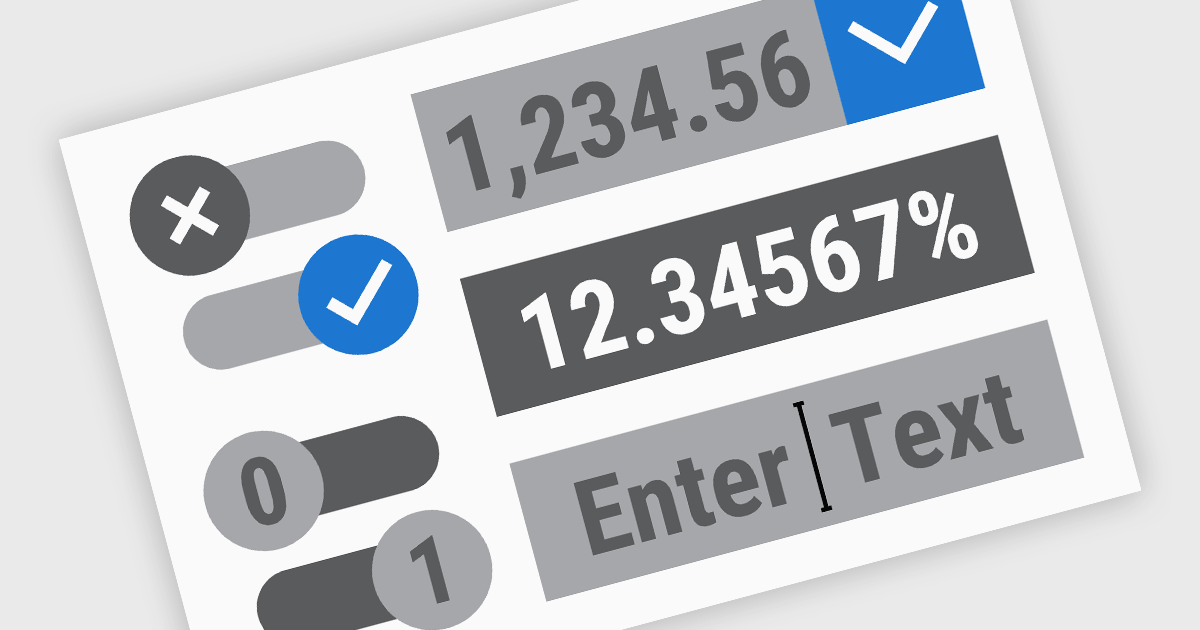
.NET Data Editor components provide a versatile set of tools for handling text, numeric, and Boolean data input within applications. These components enable developers to create user-friendly interfaces that accommodate various data entry needs, from simple text input to structured numeric formats and binary (true/false) selections. By integrating these editors, applications can ensure accuracy, enhance user experience, and streamline data validation. Whether used in forms, reports, or interactive dashboards, these components are essential for building efficient and responsive applications.
Common text, numeric and boolean data editor .NET controls include:
For an in-depth analysis of features and price, visit our .NET Data Editors comparison.
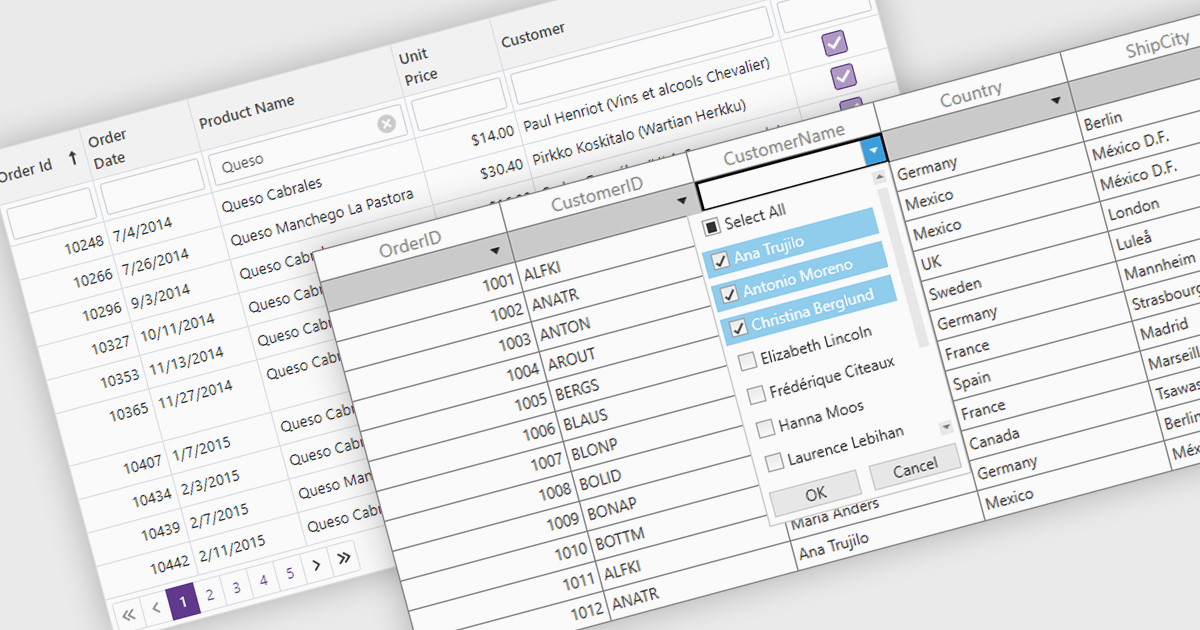
The Filter Rows feature in grids enables users to refine large datasets quickly with real-time filtering directly in the grid interface. It enhances productivity by reducing the need for manual searches, improves accuracy with precise filtering options, and streamlines workflows in .NET applications such as WinForms, WPF, and ASP.NET Core. By allowing users to filter data by text, numbers, dates, and boolean values, it simplifies data exploration and helps surface relevant information faster. This feature is especially useful in financial dashboards for transaction filtering, inventory management for quick product lookups, and CRM systems for refining customer records, making data handling more efficient and intuitive.
Several .NET grid controls offer filter row functionality including:
For an in-depth analysis of features and price, visit our comparison of .NET Grid Controls.

Telerik UI for ASP.NET Core is a robust library of over 110 UI components designed for modern web applications. It offers high performance, scalability, and extensive customization to meet diverse requirements in data handling, UX, design, and accessibility. Key components like the Grid, Scheduler, Chart, and Editor enable intuitive data visualization and manipulation, making it ideal for applications ranging from interactive dashboards to complex enterprise solutions. With Telerik UI for ASP.NET Core, developers can create feature-rich, professional-grade applications with ease.
The Telerik UI for ASP.NET Core 2025 Q1 update enhances the PDFViewer with built-in text highlighting and free text annotation capabilities, enabling users to integrate seamless document review and collaboration features into their applications. These enhancements provide users with a more efficient way to mark up PDFs without requiring third-party tools, ensuring a smoother workflow within web-based applications. The new annotation tools are fully customizable, allowing developers to tailor the experience to specific user needs while maintaining a consistent UI. With improved interaction and flexibility, this update simplifies document handling and enhances the overall usability of PDFViewer in modern applications.
To see a full list of what's new in 2025 Q1 (2025.1.211), see our release notes.
Telerik UI for ASP.NET Core is licensed per developer and has two licensing models: an annual Subscription License and a Perpetual License. The Subscription license provides access to the latest product updates, technical support, and exclusive benefits for a flat annual fee, and must be renewed to continue using the software. The Perpetual license is a one-time purchase granting access to the current released version and includes a one-year subscription for product updates and technical support. After this initial period, users can choose to renew the subscription element to continue receiving updates and support; otherwise, they may continue using the installed version available during their active subscription term but will forgo future updates and support. See our Telerik UI for ASP.NET Core licensing page for full details.
Telerik UI for ASP.NET Core is available individually or as part of the following products:
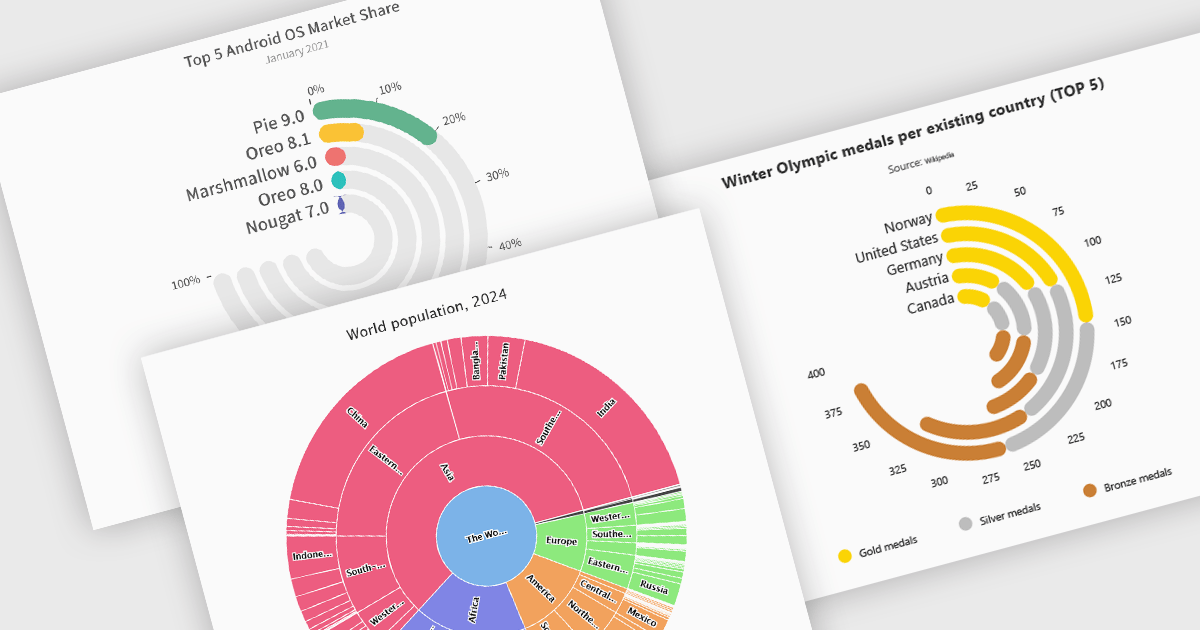
Radial charts provide an intuitive way to visualize hierarchical and categorical data. They display bars on a polar coordinate system instead of a cartesian system, which uses an x-y grid for positioning data. These charts represent values in a circular layout, making it ideal for comparing proportions and relationships between data points. Circular bar charts, a variation of the traditional bar chart, arrange data in a radial format for displaying comparisons between categories. They are particularly useful for visualizing periodic or cyclical data, such as time-based metrics. Sunburst charts break down hierarchical structures into concentric rings. The center of the chart typically represents the root category, while outer rings depict subcategories. These are used for visualizing part-to-whole relationships within a dataset. Many .NET charting components support these visualization types, allowing developers to create dynamic, interactive, and visually appealing dashboards in .NET applications.
Several .NET charting components provide you with radial charts, including:
For an in-depth analysis of features and price, visit our .NET chart components comparison.

Rich text editors for WinForms let users create and format content in a familiar, word processor-like environment. These editors support advanced text styling, media embedding, and customizable toolbars, giving developers flexibility to build feature-rich desktop applications. With features like document import/export, content validation, and extensive formatting controls, they enhance the user experience while ensuring consistency across applications. Designed for accessibility and optimized for desktop performance, they integrate seamlessly into Windows-based workflows.
Several .NET WinForms UI suites offer rich text editors including:
For an in-depth analysis of features and price, visit our comparison of .NET WinForms UI Suites:
電話: (888) 850 9911
Fax: +1 770 250 6199


