


公式サプライヤー
公式および認定ディストリビューターとして200社以上の開発元から正規ライセンスを直接ご提供いたします。
当社のすべてのブランドをご覧ください。
EPPlus is a powerful and versatile .NET library for managing and manipulating Microsoft Excel files using the Office Open XML (OOXML) format. It is a lightweight and efficient library that is easy to use and can be integrated into a wide range of applications. It allows developers to create, read and modify spreadsheets without dependencies on any other library. Features include pivot tables, styling, VBA/Form controls, conditional formatting, charts, tables, formula calculation, data validation, pictures/shapes, and more.
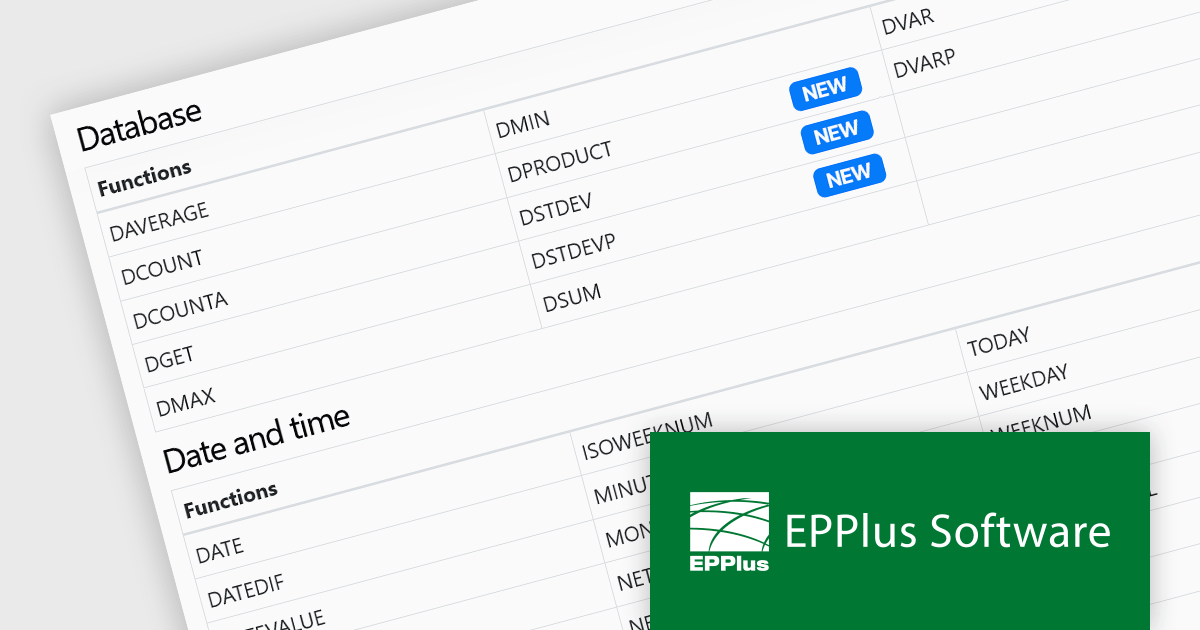
The EPPlus v7.3.0 update introduces four new functions that are supported in formula calculations, enhancing the library's capability for data analysis within Microsoft Excel spreadsheets. The GROWTH function enables exponential growth calculations, while DPRODUCT allows the multiplication of values in a field of a list or database based on specified criteria. The DSTDEV and DSTDEVP functions calculate the standard deviation of values in a field within a list or database, but they differ in their scope. DSTDEV is for samples, while DSTDEVP is used for entire populations. These functions allow developers to perform more complex statistical and mathematical operations directly within spreadsheet documents, significantly improving the efficiency of data-driven applications.
To see a full list of what's new in v7.3.0, see our release notes.
EPPlus is licensed per developer and is available as both perpetual licenses and subscription based licenses with periods of 1 year and 2 years, which include support and upgrades. See our EPPlus licensing page for full details.
For more information, see our EPPlus product page.
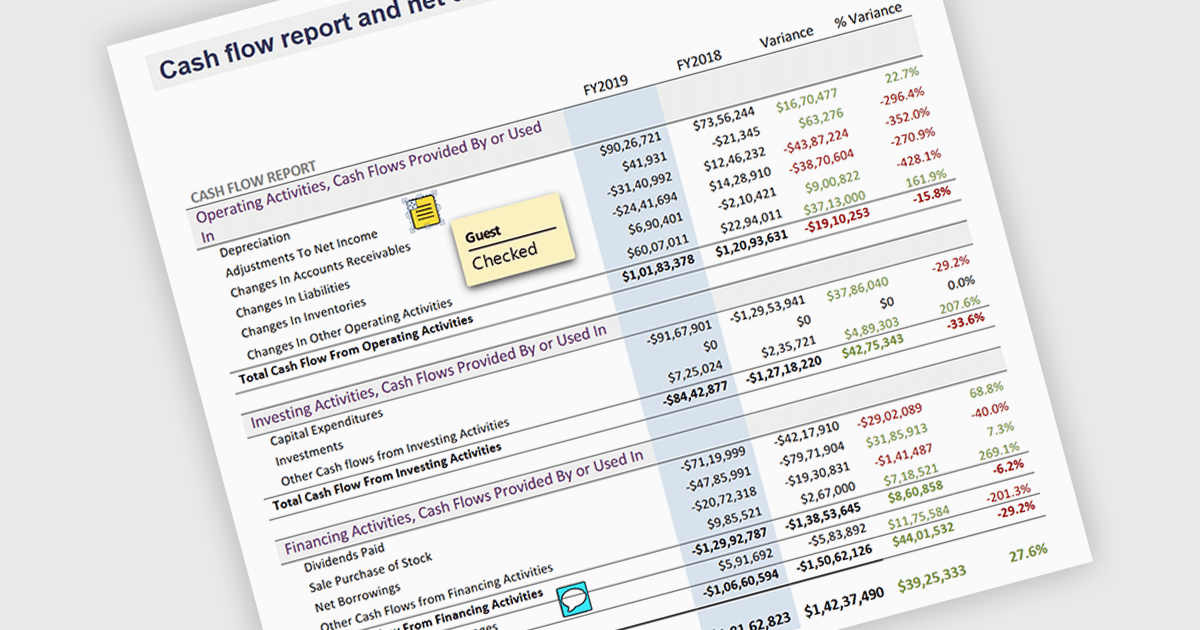
Sticky note annotations are digital notes that can be attached to specific parts of a document or webpage. They allow users to highlight text, add comments, or ask questions directly on the content they are viewing. This feature is particularly useful for collaboration, as it enables multiple people to contribute to the same document and easily see each other's thoughts and insights. Sticky note annotations can also be used for personal reference, helping users to remember important points or track their progress through a document.
Several ASP.NET Core PDF viewer controls offer support for sticky note annotations including:
For an in-depth analysis of features and price, visit our ASP.NET Core PDF viewer controls comparison.
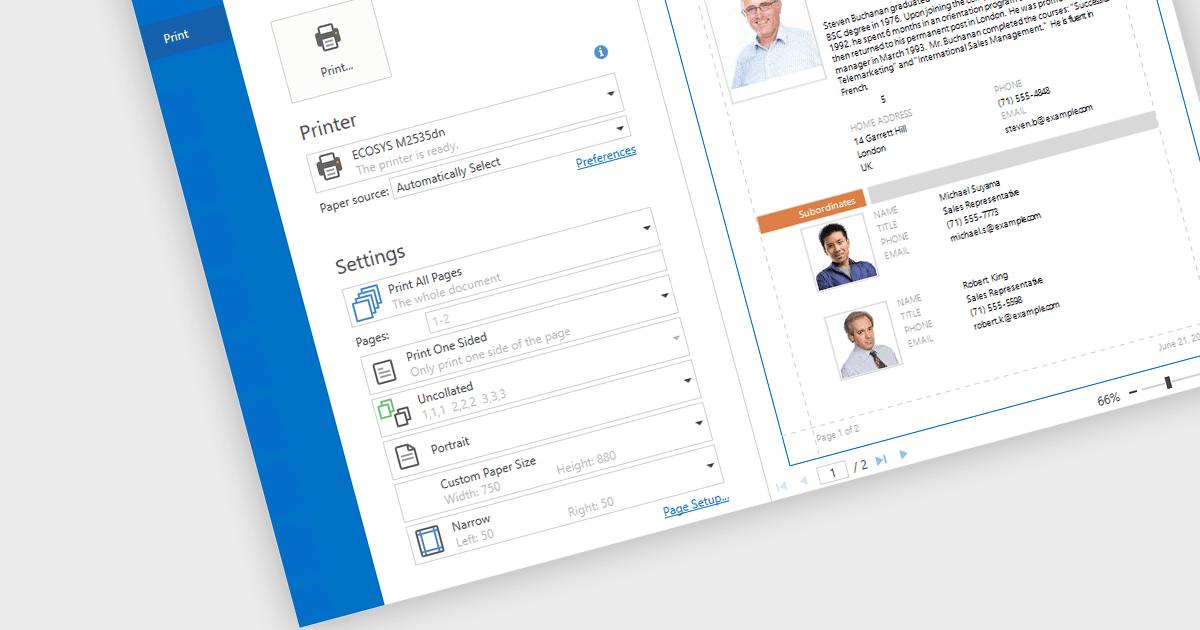
Print & Preview .NET WPF controls provide a comprehensive solution for printing and previewing content within your WPF applications. These controls offer a user-friendly interface for users to review their content before committing to printing, ensuring accuracy and preventing costly errors. Additionally, they support various printing options, including page orientation, margins, and scaling, allowing developers to customize the printing experience to meet specific requirements.
Many .NET WPF UI Suites contain Print & Preview controls including:
For an in-depth analysis of features and price, visit our comparison of .NET WPF UI Suites.
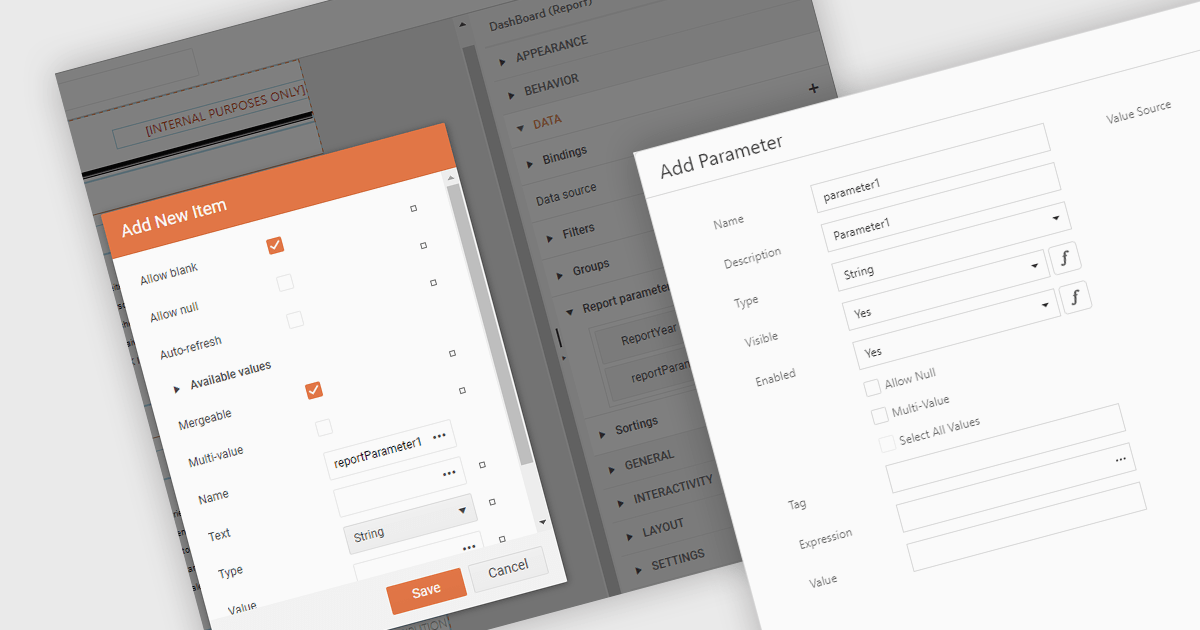
Dialog forms for parameters in .NET reporting components offer a user-friendly interface for defining and modifying report parameters. By providing intuitive input fields, drop-down menus, and browsing options, these forms simplify the report creation process and reduce the likelihood of errors. This is particularly beneficial for non-technical users, who can easily generate customized reports without requiring extensive knowledge of report syntax or data structures. Example use cases include creating sales reports based on specific product categories or time periods, generating financial statements with customizable filters, and producing personalized customer reports based on individual preferences.
Several .NET reporting components allow you to create dialog forms for parameters, including:
For an in-depth analysis of features and price, visit our comparison of .NET reporting components.
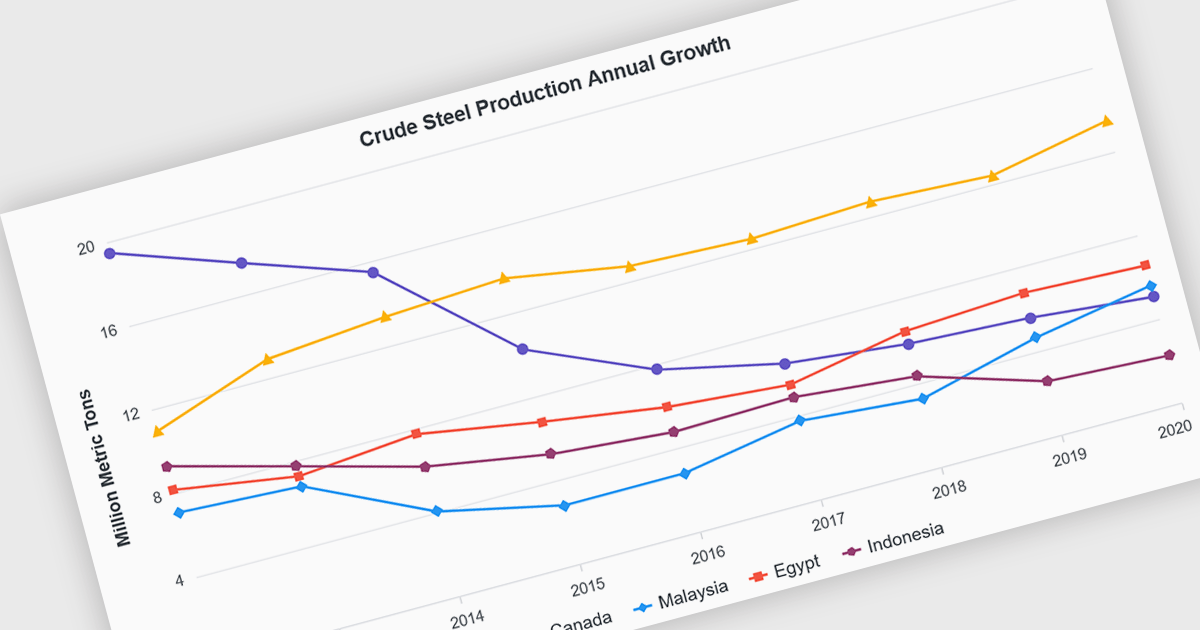
Line charts are visual representations of data points connected by lines, often used to illustrate trends, patterns, or changes over time. They are particularly effective for displaying continuous data sets, such as stock prices, temperature variations, or sales figures. By connecting data points, line charts provide a clear and intuitive understanding of how values evolve over a specific period. This visual representation aids in identifying trends, making comparisons, and predicting future outcomes.
Several Blazor chart controls offer line charts including:
For an in-depth analysis of features and price, visit our Blazor chart controls comparison.
電話: (888) 850 9911
Fax: +1 770 250 6199


