


公式サプライヤー
公式および認定ディストリビューターとして200社以上の開発元から正規ライセンスを直接ご提供いたします。
当社のすべてのブランドをご覧ください。
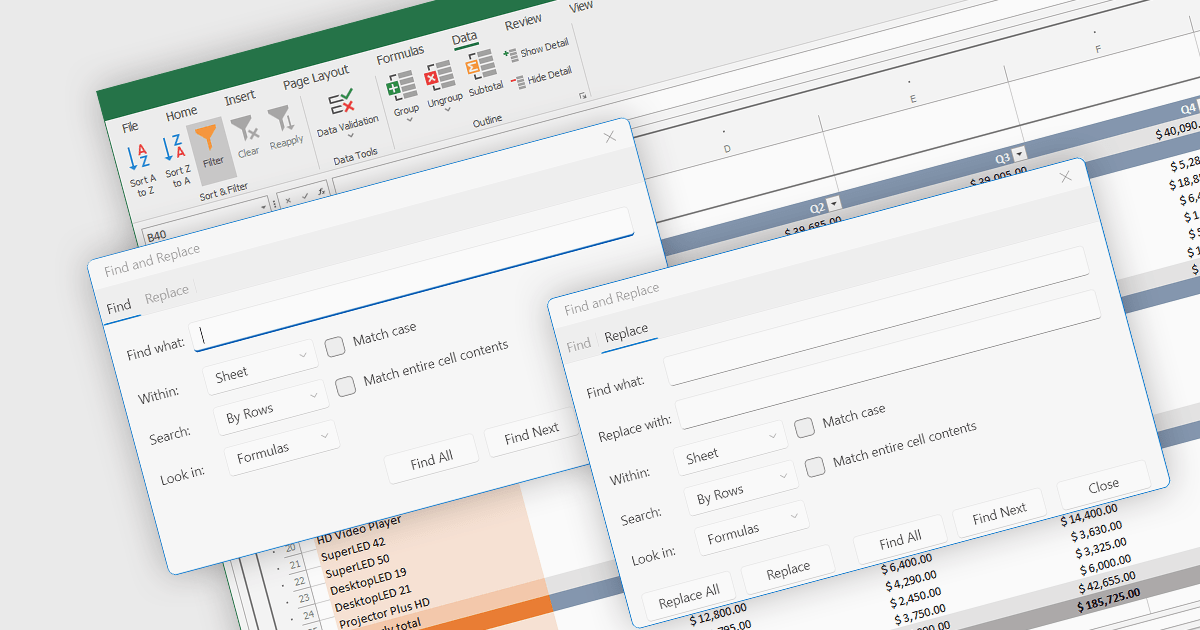
Find and replace is a useful feature found in spreadsheet applications that allows users to quickly locate specific values, i.e. text, numbers, or formulas, identifying all instances of that search term within a spreadsheet and then being able to replace them with a new value. By automating the process of manually searching for and modifying each occurrence individually, find and replace enhances productivity, reduces the likelihood of human error, and ensures consistency throughout the spreadsheet. This functionality is especially beneficial for tasks that involve managing large volumes of data, updating outdated information, correcting mistakes, or standardizing data formats.
Several .NET 8 spreadsheet components allow you to find and replace, including:
For an in-depth analysis of features and price, visit our comparison of .NET 8 spreadsheet components.
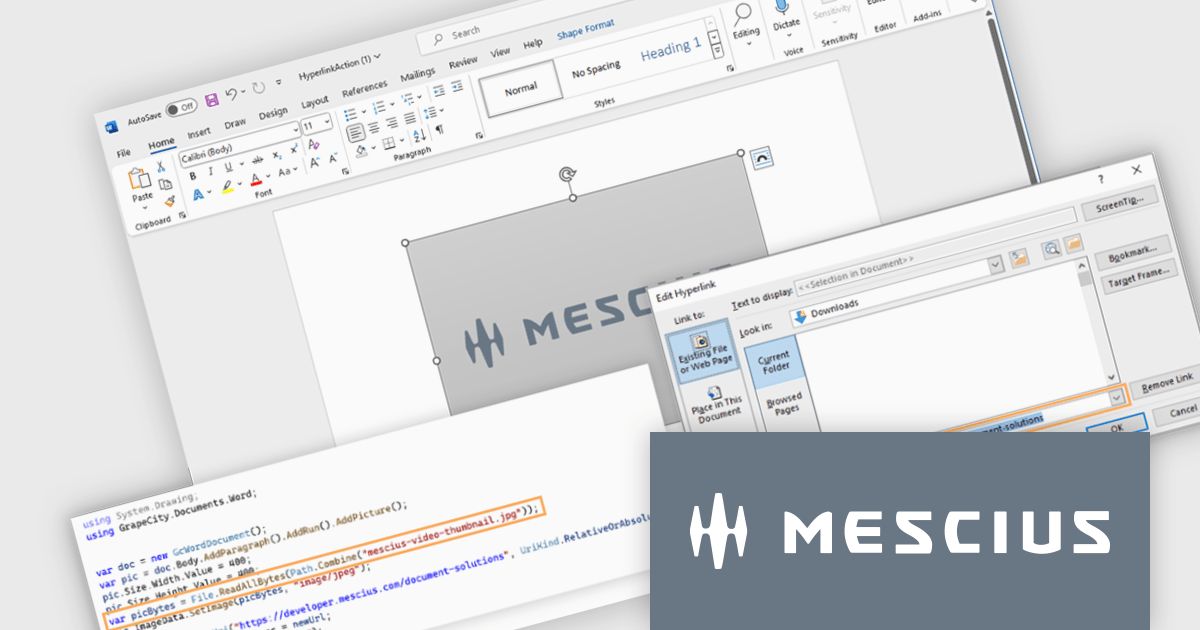
Document Solutions for Word by MESCIUS is a comprehensive software development toolkit designed to facilitate the creation, manipulation, and management of Microsoft Word documents within various applications. It offers a robust API that provides developers with granular control over document structure, formatting, and content, enabling the integration of Word document functionality into custom applications. Key features include support for advanced formatting options, document automation, and compatibility with various Word document formats.
The Document Solutions for Word 7.2 release enables developers to enhance the interactivity of Word documents by programmatically adding hyperlink properties to shapes. You can now seamlessly link shapes to specific URLs, documents, or email addresses. By leveraging these properties, developers can create dynamic and engaging Word documents that respond to user actions, providing a more interactive and immersive experience.
To see a full list of what's new in version 7.2, see our release notes.
Document Solutions for Word is licensed per developer and is available in several license options for differing distribution needs. Team licenses are also available for multiple developers within the same organization. Visit our Document Solutions for Word licensing page to see more information regarding licenses.
Document Solutions for Word is available to buy in the following products:
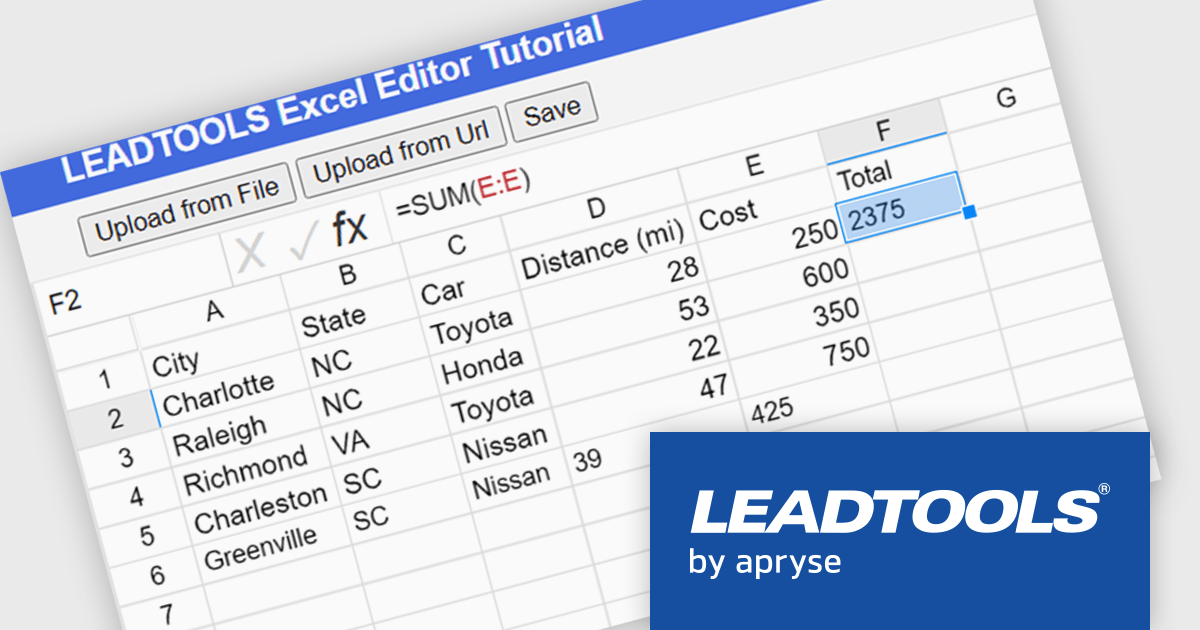
LEADTOOLS Document SDK is ideal for developing document and document imaging applications. Features include PDF viewing, comprehensive annotation and markup, specialized bitonal image displaying, and image processing. Other features include performance and memory optimizations for bitonal images, document image cleanup, including inverted text, border, hole-punch, and line removal, and scanning with LEADTOOLS Fast TWAIN and WIA. The LEADTOOLS Excel SDK - included in the Document SDK - gives developers the power to load, create, edit, and save Excel sheets programmatically.
In this blog post (the second in a 3-part series on the Excel SDK), LEADTOOLS Associate Marketing Web Developer Ryan Fritz shows you how to use the new Excel Web Editor to load an XLS/XLSX file, implement a common Excel function, and then save the updated file.
Read the complete blog and learn how to give your web applications this powerful and useful capability.
LEADTOOLS Document SDK is licensed as Development Licenses, for developers to use the SDKs, and Deployment Licenses, for the right to distribute end user solutions. See our LEADTOOLS Document SDK licensing page for full details.
Learn more on our LEADTOOLS Document SDK product page.
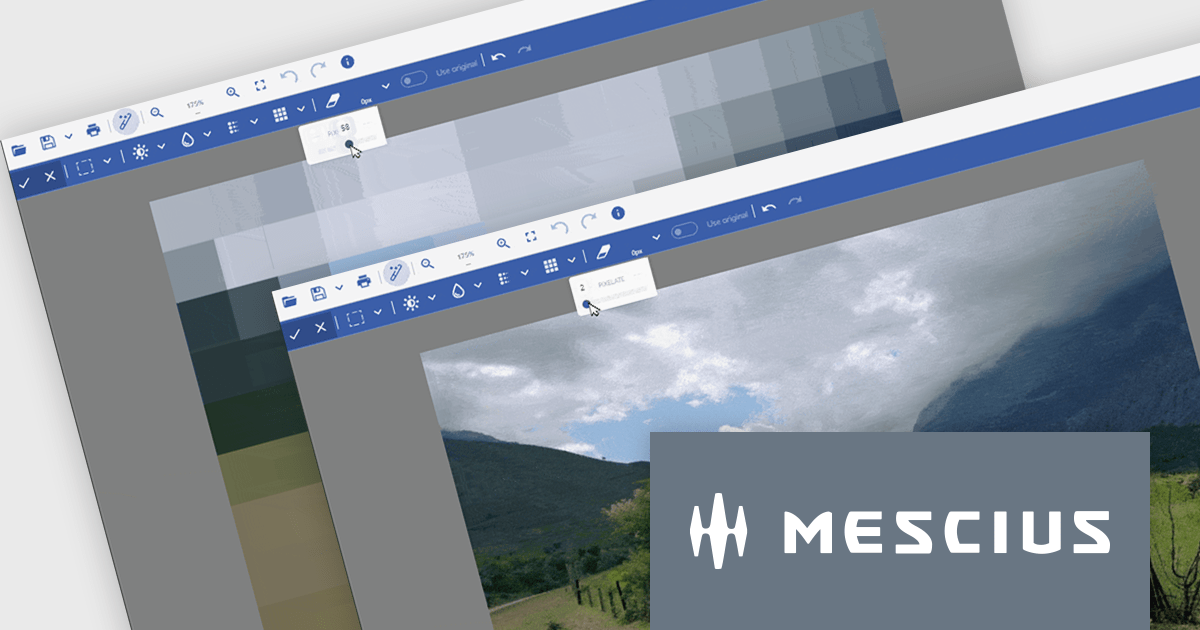
Document Solutions for Imaging by MESCIUS is a comprehensive software development toolkit designed to facilitate the manipulation and management of image files within various applications. It offers a robust API that provides developers with granular control over image properties, formats, and rendering, enabling the integration of image processing functionality into custom applications. Key features include support for a wide range of image formats, image editing operations, and optimization techniques for efficient image handling.
The Document Solutions for Imaging 7.2 release introduces enhanced image processing capabilities with the addition of new Blur and Pixelate functionality. These tools can be applied to selected areas, allowing developers to precisely control image manipulation and maintain the integrity of the remaining image content. This feature empowers developers to create visually appealing image-based applications.
To see a full list of what's new in version 7.2, see our release notes.
Document Solutions for Imaging is licensed per developer and is available in several license options for differing distribution needs. Team licenses are available for multiple developers within the same organization. Visit our Document Solutions for Imaging licensing page to see the full details.
Document Solutions for Imaging is available to buy in the following products:
DevExpress DXperience is a comprehensive software development suite designed to enhance productivity and streamline the creation of high-performance applications across various platforms. It offers a wide range of tools and components for developers working with .NET frameworks including Windows Forms, WPF, ASP.NET, and Blazor as well as JavaScript, Angular, React, Vue, and jQuery. The suite includes powerful UI controls, data visualization tools, reporting capabilities, and cross-platform libraries that enable developers to build modern, responsive, and visually appealing applications efficiently.
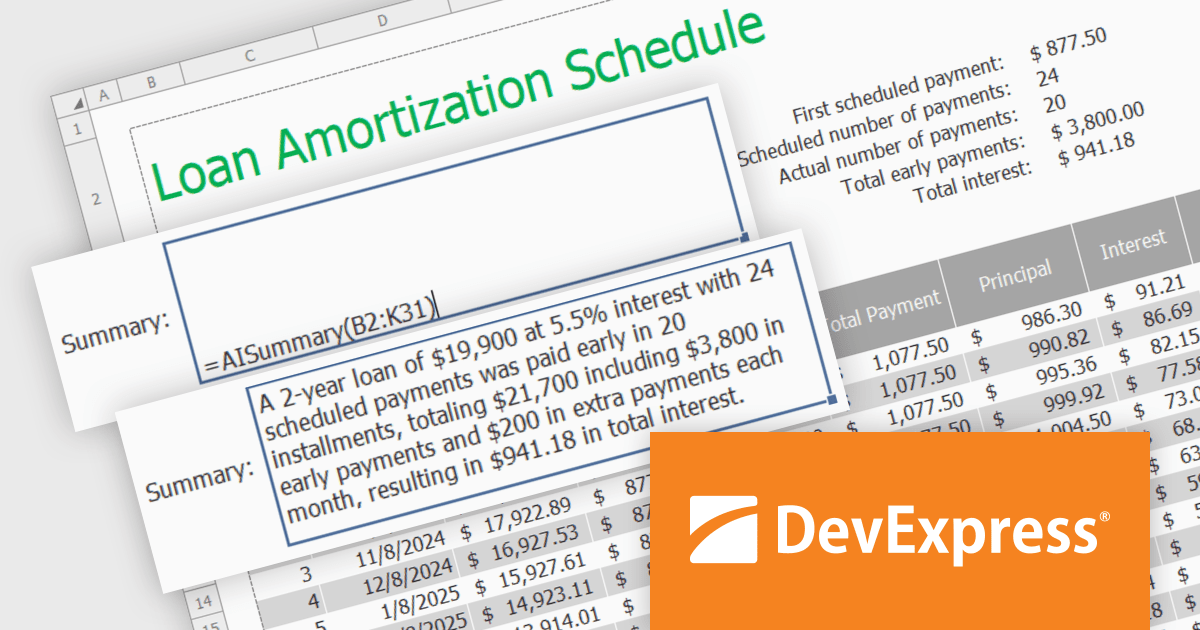
In this blog post, DevExpress's Maria Nikulina shows you how to integrate OpenAI services with the DevExpress WinForms Spreadsheet Control (included with DXperience) to implement user-defined formulas for advanced calculations. These formulas let you automate repetitive tasks, efficiently analyze data, and execute advanced calculations not possible with built-in functions.
Steps include:
Detailed sample code is included.
Read the complete blog to learn how to take Excel formula calculations to a whole new level by integrating AI services.
DevExpress DXperience is licensed per developer and is available as a Perpetual License with a 12 month support and maintenance subscription. See our DevExpress DXperience licensing page for full details.
The DevExpress WinForms Spreadsheet Control is available to buy in the following products:
電話: (888) 850 9911
Fax: +1 770 250 6199


