


公式サプライヤー
公式および認定ディストリビューターとして200社以上の開発元から正規ライセンスを直接ご提供いたします。
当社のすべてのブランドをご覧ください。
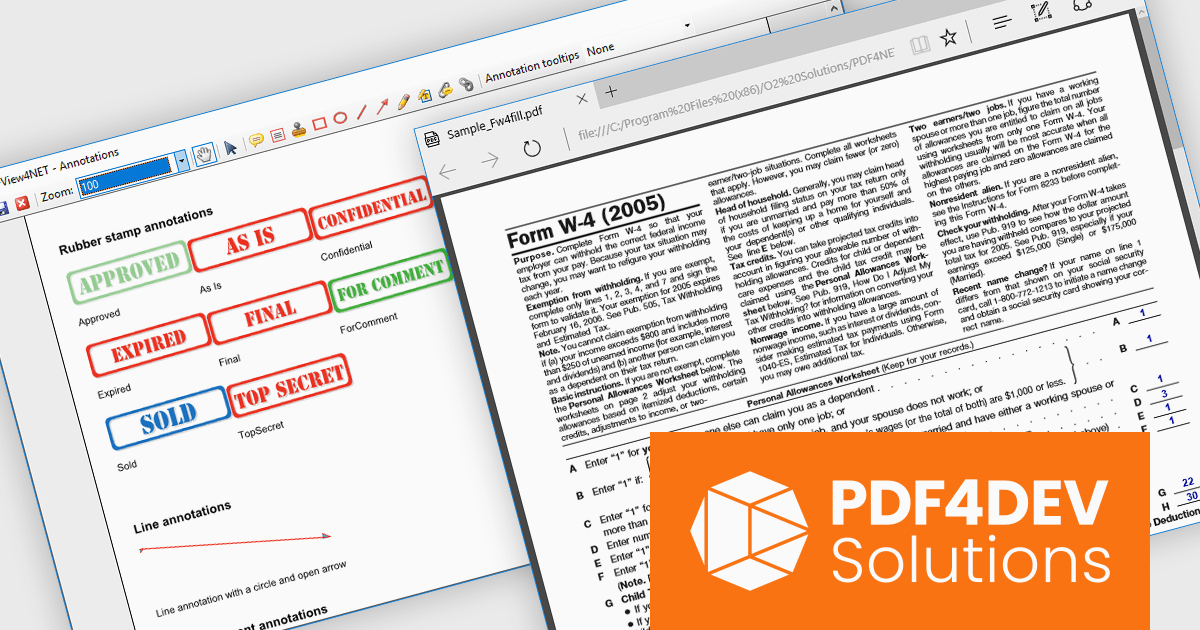
PDF4DEV Solutions (previously O2 Solutions) offers .NET components for PDF manipulation and rendering, designed to integrate into .NET environments. Its flagship products, PDF4NET and PDFView4NET, make building robust PDF solutions simple. PDF4NET improves PDF creation and editing with an intuitive object model, eliminating the need for Adobe tools. PDFView4NET enables viewing, annotating, and printing PDFs, supporting Windows Forms and WPF with features like bookmark navigation and file attachments.
PDF4DEV Solutions adds full support for .NET 10, enabling software developers to leverage the latest performance, security, and tooling improvements within the modern .NET ecosystem. This update ensures reliable compatibility across platforms, improves integration with current development processes, and supports the use of new C# language features for more efficient and maintainable code. Developers benefit from smoother application upgrades, improved runtime stability, and a future-ready foundation that aligns with evolving industry standards for .NET-based PDF processing.
Support for .NET 10 is available across the PDF4DEV Solutions .NET product range:
PDF4DEV Solutions products are licensed per developer and include a 12 month subscription which provides all major and minor product updates and technical support. See our PDFBundle4NET licensing page for full details.
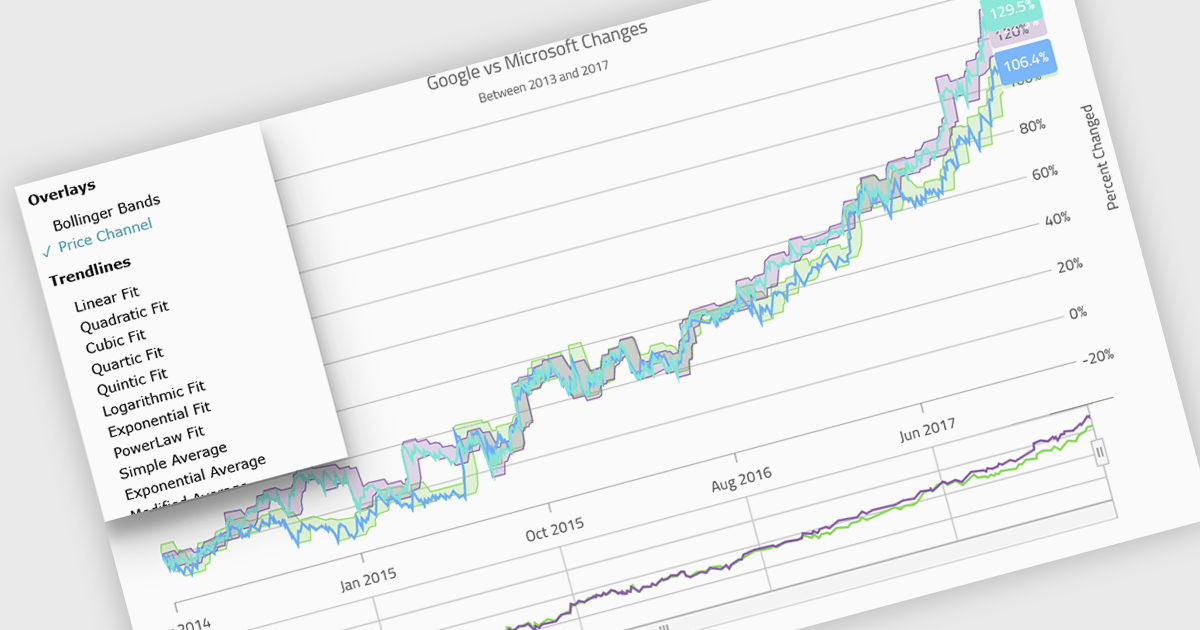
Indicators in a chart component are visual tools used to represent specific statistical or mathematical calculations directly on the chart, often to highlight trends, patterns, or key thresholds within the underlying data. Common in financial and analytical applications, indicators can include elements like moving averages, Bollinger Bands, or threshold lines. For software developers, implementing indicators provides a powerful way to enhance data interpretation by allowing users to see meaningful context and actionable insights without needing to leave the chart interface. This improves decision-making and supports more interactive and informative visualizations across a wide range of use cases.
Several .NET Blazor charting controls support indicators including:
For an in-depth analysis of features and price, visit our comparison of .NET Blazor Chart Controls.
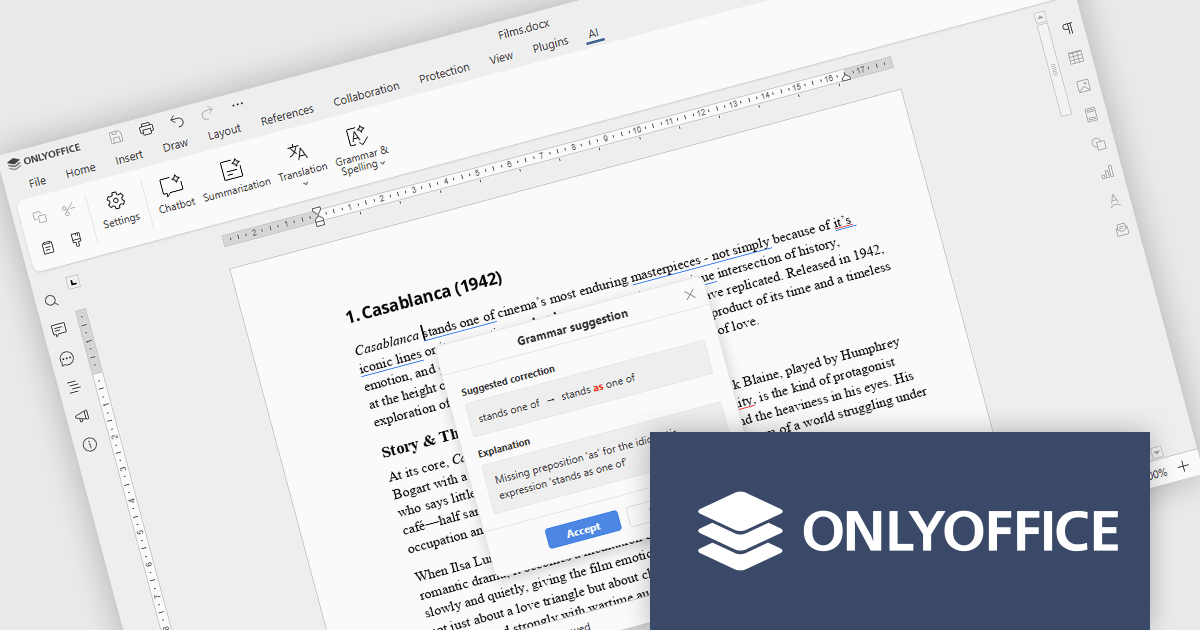
ONLYOFFICE Docs is a comprehensive online editor, allowing users to create text documents, spreadsheets, presentations, and forms. It enables your users to edit, share, and collaborate on documents online in their preferred browser, within your own application. It is fully compatible with OOXML (Office Open XML) formats and supports popular Microsoft Office and other document formats such as CSV, DOC, DOCX, EPUB, HTML, ODP, ODS, ODT, PDF, PPT, PPTX, RTF, TXT, XLS, and XLSX.
The ONLYOFFICE Docs v9.2 update integrates AI-powered spell and grammar checking, now available directly through the AI plugin, so developers can review and refine documentation without leaving their editing environment. This reduces the time spent on proofreading and eliminates the need to rely on separate tools or browser extensions for basic language quality checks. As a result, development teams can keep their documentation professional and easy to understand while staying focused on implementation, code quality, and delivery timelines.
To see a full list of what's new in v9.2.0, see our release notes.
ONLYOFFICE Docs Developer Edition is licensed by the number of simultaneous document connections and is available as an annual license with 1 year support and upgrades. See our ONLYOFFICE Docs Developer Edition licensing page for full details.
For more information, see our ONLYOFFICE Docs Developer Edition product page.
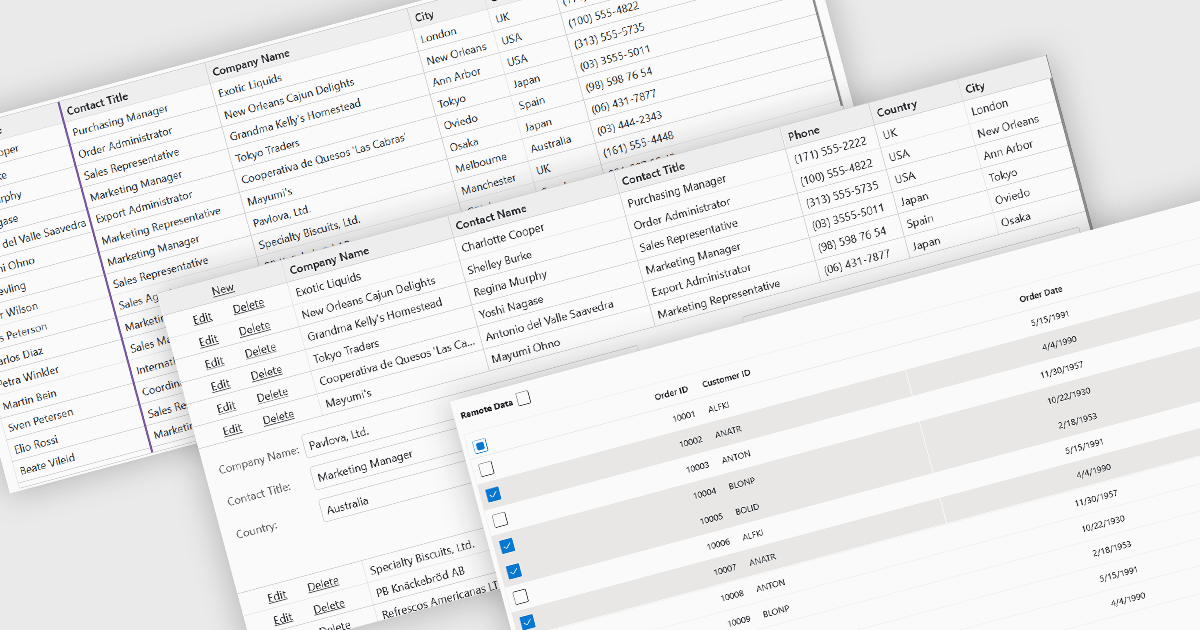
Row and column features form the core of modern grid components, enabling users to view, navigate, and manipulate tabular data efficiently. These capabilities improve usability and help developers present information in a structured, interactive format suited to many types of applications. By offering clear ways to organise, edit, and inspect information, row and column features allow users to work more effectively while maintaining control over how content is displayed.
Common features include:
For an in-depth analysis of features and price, visit our Blazor grid components comparison.
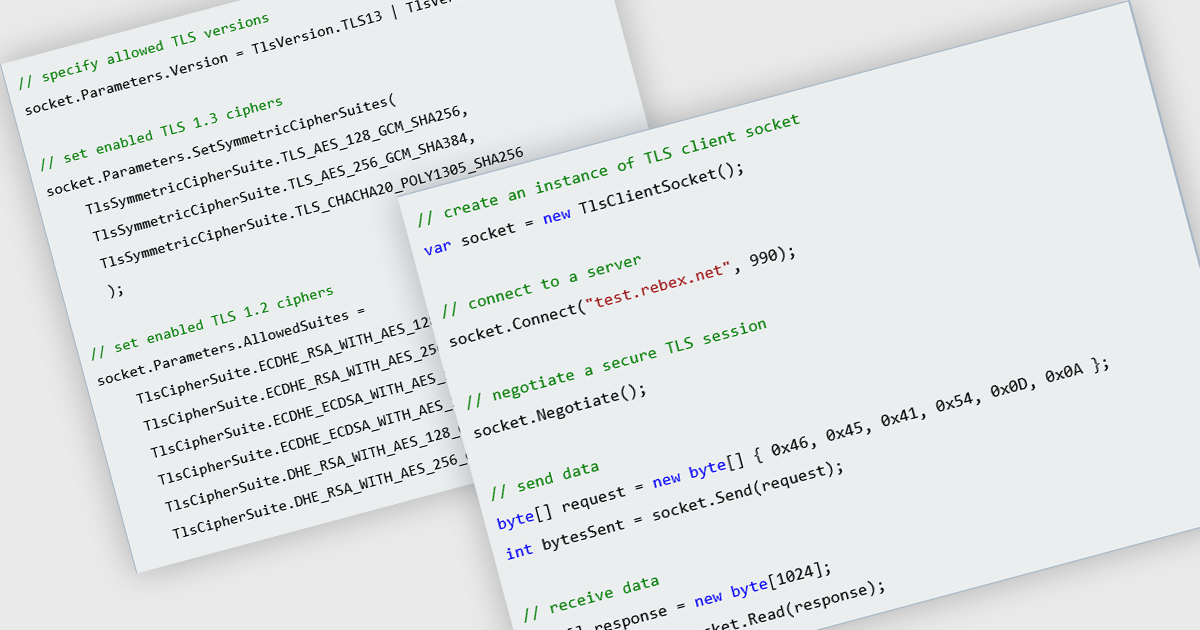
TLS support in an internet component refers to the implementation of Transport Layer Security, a protocol that encrypts data exchanged between systems over a network. For software developers, this ensures that data sent and received by the component is protected against eavesdropping, tampering, and forgery, which is essential for maintaining secure communications in modern applications. By using TLS, developers can meet compliance requirements, safeguard user information, and build trust in the integrity of their applications' network interactions.
Several Comms & Messaging components for .NET offer TLS support including:
For an in-depth analysis of features and price, visit our comparison of .NET Comms & Messaging.
電話: (888) 850 9911
Fax: +1 770 250 6199


