


公式サプライヤー
公式および認定ディストリビューターとして200社以上の開発元から正規ライセンスを直接ご提供いたします。
当社のすべてのブランドをご覧ください。
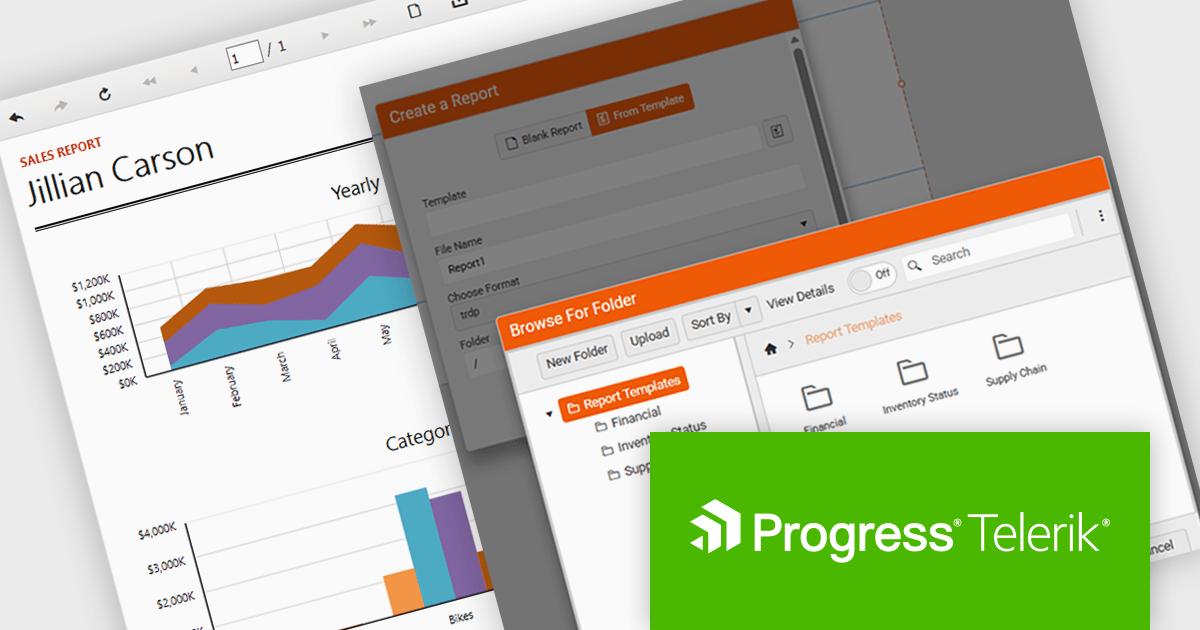
Telerik Reporting is a comprehensive and lightweight embedded reporting tool for .NET web and desktop applications. It enables developers and reporting users to create, design, and export visually appealing, interactive, and reusable reports to effectively present analytical and business data. It supports various technologies, including ASP.NET Core, Blazor, ASP.NET MVC, ASP.NET AJAX, HTML5/JS, Angular, WPF, WinForms, and WinUI.
The Telerik Reporting 2025 Q4 update introduces customizable report templates in the Web Report Designer, giving developers a faster and more controlled way to produce consistent, production-ready reports. By allowing teams to define, save and reuse templates that include predefined layout structures, styling rules and data components, the feature reduces repetitive setup work, maintains uniform design standards across projects and ensures every new report begins with a reliable, compliant foundation.
To see a full list of what's new in 2025 Q4 (19.3.25.1111), see our release notes.
Telerik Reporting is licensed per developer and is available as a perpetual license with a one year support subscription, which is offered in three tiers: Lite, Priority or Ultimate. See our Telerik Reporting licensing page for full details.
Telerik Reporting is available to buy in the following products:
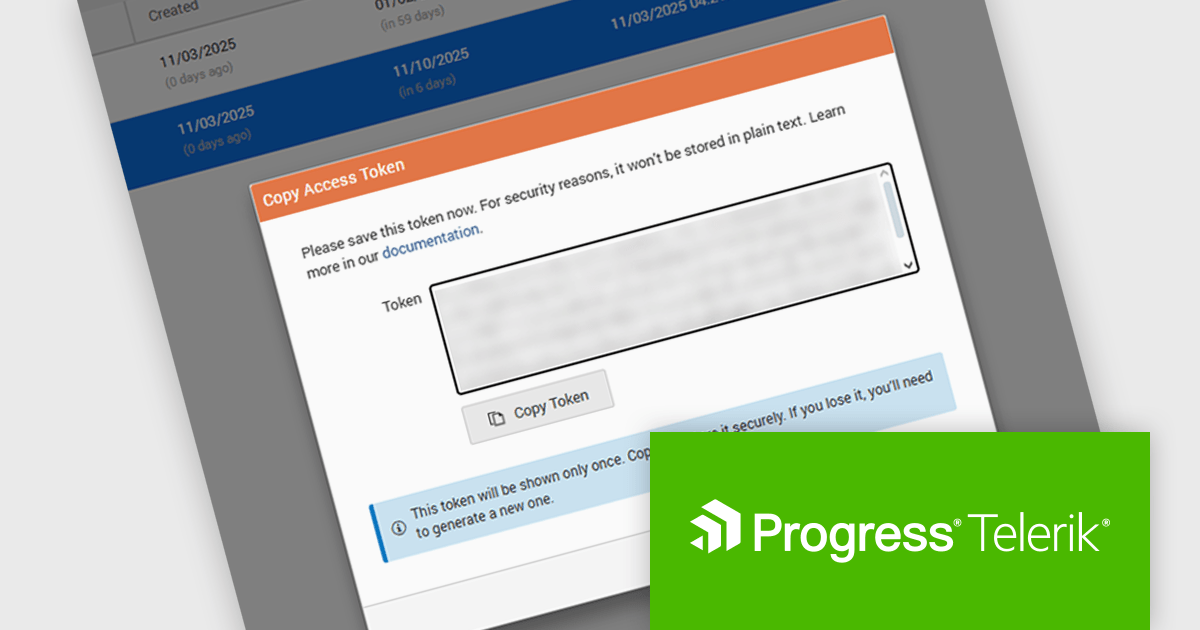
Telerik Report Server is a comprehensive and flexible end-to-end solution for managing reports. Built with the Telerik Reporting library, it is a server-based Windows web application that provides centralized storage, organization, and previewing of reports, along with features for scheduling, delivery, and user management. Report Server can act as a standalone solution or be integrated within an application, allowing developers to create, manage, and distribute reports across multiple platforms including Blazor, Angular and Windows Forms.
The Telerik Report Server 2025 Q4 update introduces Access Token Provisioning directly in the RS.NET UI, giving developers a more efficient and controlled way to authenticate applications and services without relying on external scripts or manual API calls. This enhancement centralizes token management by allowing tokens to be generated, reviewed, and maintained within the interface itself. It also enables developers to create time-bound sharing links backed by temporary user permissions, providing a secure and predictable method for distributing report documents while maintaining clear control over access duration and scope.
To see a full list of what's new in 2025 Q4 (11.3.25.1111), see our release notes.
Telerik Report Server is available as a perpetual or annual license and is licensed per domain. Each domain license contains 15 Client Access Licenses and 1 year support and maintenance. See our Telerik Report Server licensing page for full details.
Telerik Report Server is available individually or as part of Telerik DevCraft Ultimate.
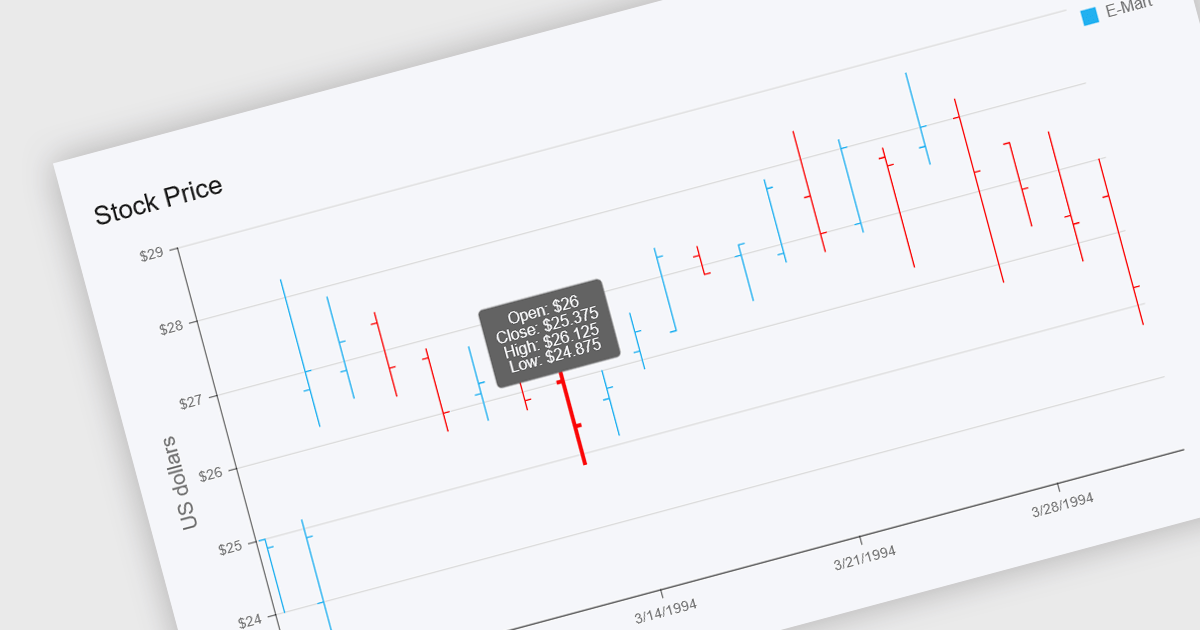
OHLC charts, short for Open-High-Low-Close charts, are a type of financial chart used to represent price movements of assets over a specific time period. Each point on the chart summarizes a single period's opening, highest, lowest, and closing prices, typically displayed using vertical bars with ticks to indicate opening and closing values. This format offers a clear and compact way to visualize volatility and market trends within a given timeframe. For developers and analysts working with financial data, OHLC charts are especially valuable for identifying price patterns, monitoring market behavior, and making informed decisions based on historical performance.
Several .NET chart components offer OHLC charts, including:
For an in-depth analysis of features and price, visit our comparison of .NET chart components.
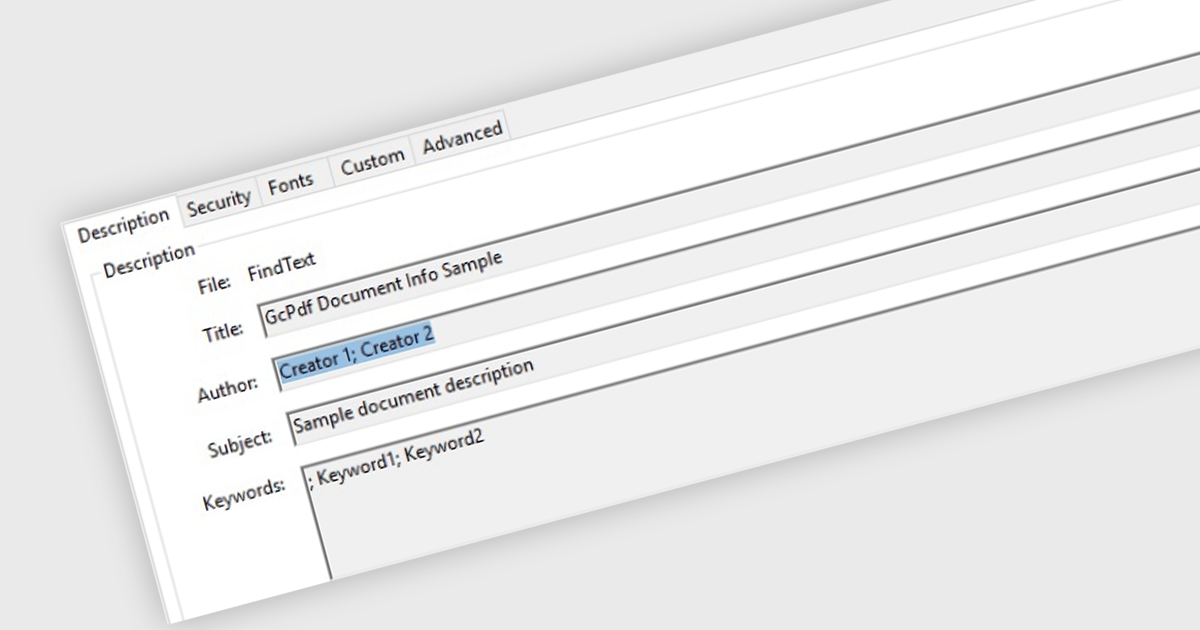
Managing Metadata in the context of PDF Viewer components for ASP.NET Core, refers to the ability to view, edit, and update the descriptive information embedded within a PDF file. This metadata typically includes details such as the document's title, author, subject, keywords, creation and modification dates, and application used to create the file. Managing metadata allows developers and end users to keep document properties accurate and relevant, which can be important for document indexing, searching, and compliance with organizational standards. This feature is especially useful in document management systems where accurate metadata supports efficient retrieval and categorization.
Several PDF Viewer ASP.NET Core components offer metadata management features including:
For an in-depth analysis of features and price, visit our comparison of ASP.NET Core PDF Viewer Components.
DevCraft by Telerik is a comprehensive AI-powered suite of more than 1,250 UI components and development tools designed for building modern web, desktop, and mobile applications using .NET and JavaScript frameworks. It includes reporting and report management solutions, automated testing and mocking tools, and document processing libraries, as well as a wide range of professionally designed user interface controls from the Telerik and Kendo UI suites. DevCraft enables developers to create feature-rich, high-performance applications with consistent design and user experience, delivering enterprise-level, scalable, and maintainable software solutions.
The Telerik DevCraft 2025 Q4 update adds the Agentic UI Generator which enables developers to translate natural language prompts directly into fully‑scaffolded, production‑ready user interfaces built on the Telerik and Kendo UI component libraries. It includes all the functionality of the AI Coding Assistant, as well as handling layouts, styling, responsive behavior, accessibility best‑practices, data‑bindings and theming from an MCP server that works in any AI-enabled IDE, so developers can remain in their familiar IDE and focus their effort on domain logic rather than boilerplate. This feature is only available as part of DevCraft Complete and DevCraft Ultimate subscription licenses and currently supports Blazor, Angular and React.
To see a full list of what's new in DevCraft 2025 Q4, see our release notes.
Telerik DevCraft is licensed per developer and has two licensing models: an annual Subscription License and a Perpetual License. The Subscription license provides access to the latest product updates, technical support, and exclusive benefits for a flat annual fee, and must be renewed to continue using the software. The Perpetual license is a one-time purchase granting access to the current released version and includes a one-year subscription for product updates and technical support. After this initial period, users can choose to renew the subscription element to continue receiving updates and support; otherwise, they may continue using the installed version available during their active subscription term but will forgo future updates and support. See our Telerik DevCraft Ultimate licensing page for full details.
For more information, see our product pages:
電話: (888) 850 9911
Fax: +1 770 250 6199


