


公式サプライヤー
公式および認定ディストリビューターとして200社以上の開発元から正規ライセンスを直接ご提供いたします。
当社のすべてのブランドをご覧ください。

React components in UI suites provide prebuilt, reusable building blocks for creating modern, responsive web applications using the React framework. These components are designed to integrate effortlessly into React's declarative model, enabling developers to construct complex user interfaces while maintaining consistency, performance, and maintainability. By offering a comprehensive set of controls and visual elements, UI suites help accelerate development and reduce the effort required to implement advanced functionality from scratch.
Common controls include:
For an in-depth analysis of features and price, visit our React UI suites comparison.
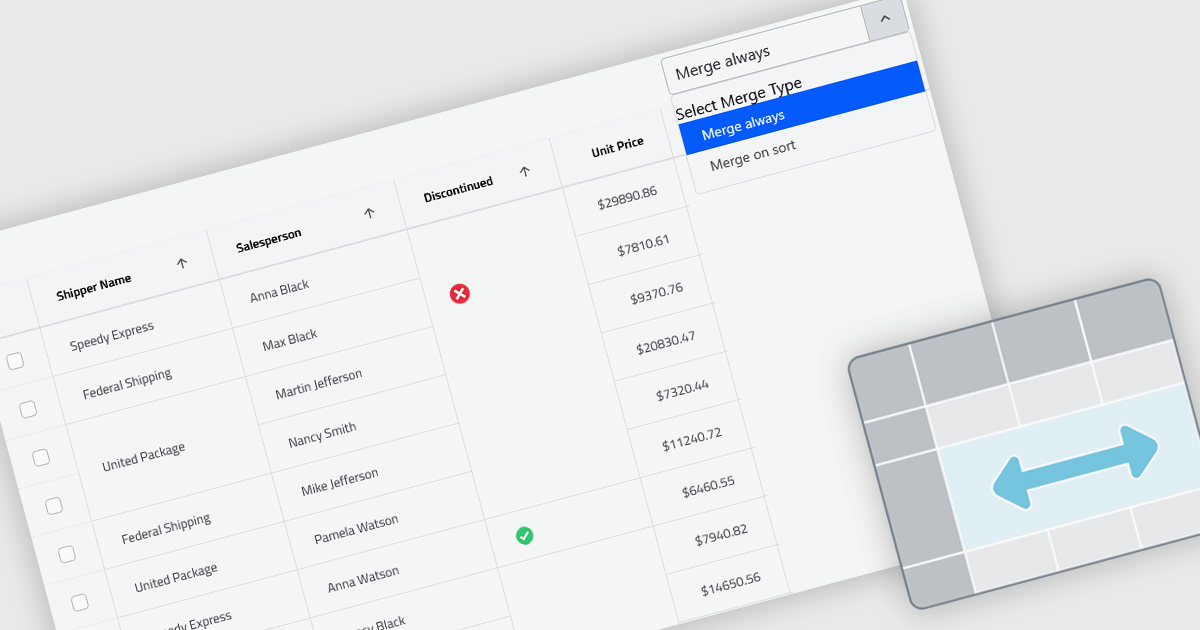
Cell merging in grids combines adjacent cells with matching or conditionally defined values into a single cell, typically within a column. This reduces repetitive data and creates cleaner, more readable tables that are easier to scan and understand. By visually grouping related rows, it helps highlight patterns and relationships in large datasets. The feature can be applied automatically or customized, making it useful for scenarios such as financial reports, schedules, and inventory lists where repeated values can be consolidated for better clarity.
Several React grid controls offer cell merge support including:
For an in-depth analysis of features and price, visit our React grid controls comparison.
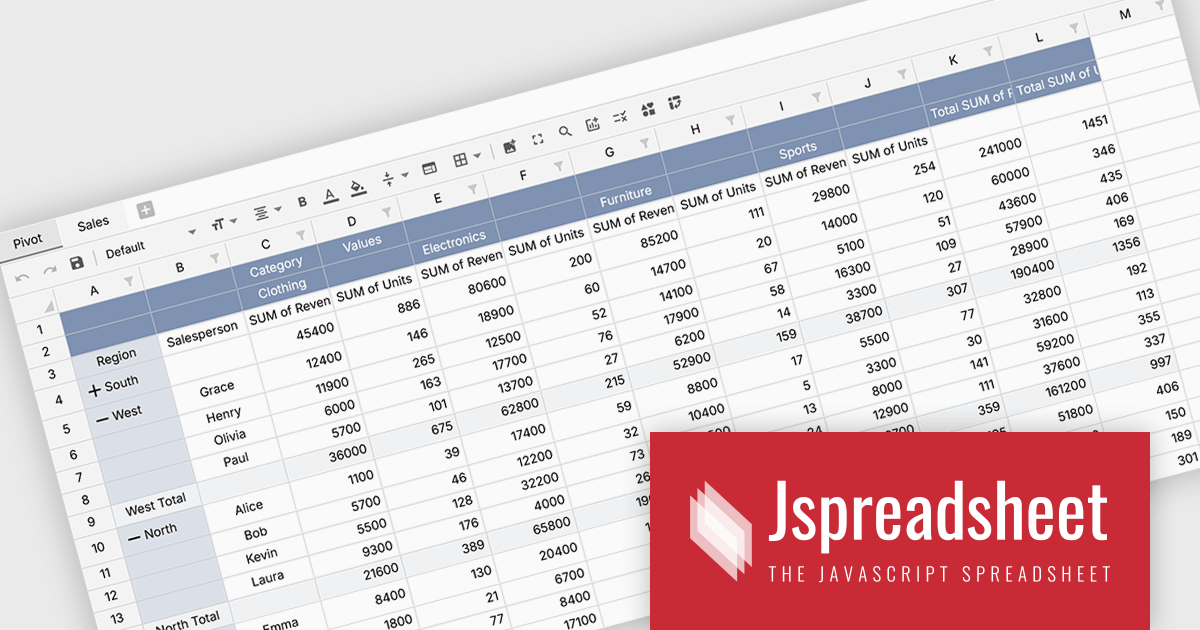
Jspreadsheet Pro is a flexible JavaScript-based spreadsheet solution that enables developers to create customizable, feature-rich data grids for web applications. It offers advanced formulas, data validation, and API integrations. Ideal for tasks like financial modeling, inventory management, and project tracking, it helps businesses efficiently manage and analyze data.
Jspreadsheet Pro introduces pivot table functionality that allows developers to summarize and analyze large datasets directly within browser based spreadsheet applications. It enables users to group data across multiple rows and columns, apply aggregation methods such as sum or average, and refine results through filtering and sorting. With built in spreadsheet formulas and cross worksheet references, developers can provide interactive data analysis capabilities without requiring external tools or additional backend processing.
Jspreadsheet Pro is licensed as an Annual or a Perpetual License with support and maintenance. We can supply any Jspreadsheet Pro license including new licenses, maintenance renewals, and upgrade licenses. See our Jspreadsheet Pro for full details.
For more information, visit our Jspreadsheet Pro product page.

Handsontable is a JavaScript library designed to help developers build interactive data grids into their web applications. Offering a familiar spreadsheet-like interface, it allows users to edit, sort, and filter data with ease. Highly customizable and compatible with popular frameworks like React and Angular, Handsontable empowers developers to build robust data manipulation features into their web applications.
The Handsontable 17.0.0 update adds a new MultiSelect cell type that allows a single cell to hold multiple values, making it well suited for data such as tags, user roles, product categories, or shipment contents. Instead of restricting entries to one option, users can choose any number of items from a dropdown interface that includes search and filtering capabilities for quickly locating options. Full keyboard navigation ensures efficient interaction for power users.
To see a full list of what's new in version 17.0.0, see our release notes.
Handsontable is licensed per developer and is available as an Annual or Perpetual license with 1 year support and maintenance. See our Handsontable licensing page for full details.
For more information, visit our Handsontable product page.
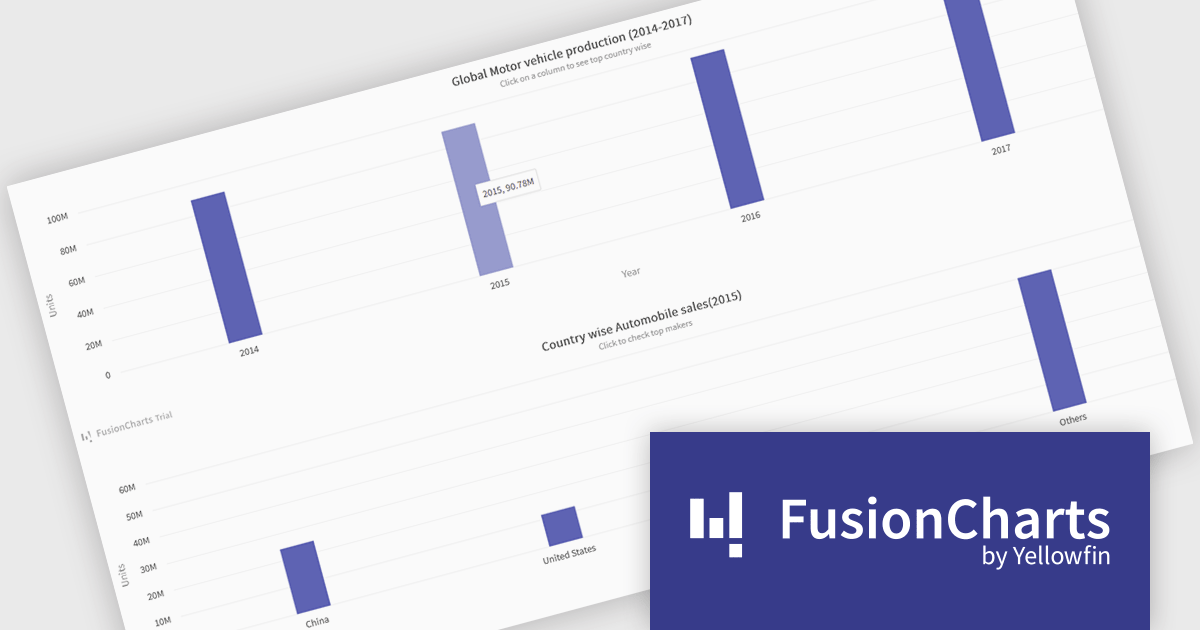
FusionCharts Suite XT is a collection of charting and mapping tools that helps developers create interactive and data-driven dashboards for their web and mobile applications. It provides a wide range of features, including over 100 chart types, data-driven maps, and a variety of customization options. FusionCharts Suite XT helps you visualize and present data in a clear and engaging way.
FusionCharts Suite XT allows developers to implement drill down charts that let users click individual data points to view related charts with more detailed information. This functionality helps developers present large or complex datasets in a structured way, allowing applications to display high level summaries while providing access to deeper data when required. By supporting multiple levels of drill down across most chart types, it supports scalable and interactive data exploration without overloading the initial visualization.
FusionCharts Suite XT is licensed through tiered plans, including Basic, Pro, Enterprise, and Enterprise+, available as annual or perpetual licenses for different developer and deployment needs. See our FusionCharts Suite XT licensing page for full details.
For more information, visit our FusionCharts Suite product page.
電話: (888) 850 9911
Fax: +1 770 250 6199


